FUNCTIONS QUESTIONS AND ANSWERS GRADE 12
Share via Whatsapp Join our WhatsApp Group Join our Telegram GroupActivity 1
- If h(x) = (½)x determine the value of h(–4). (3)
- If the function g(x) = – x2 –3x, find g(x + h) (2)
- If f(x) = 4x + 1, determine the value of:
3.1 f(x + a)
3.2 f(x) + a
3.3 af(x) (3) - If g(x) = 2x2, determine the value of:
4.1 g(–x)
4.2 –g(x) (2)
[10]
Solutions
|
In each example, there is only one possible y-value for each x-value, so f(x); h(x) and g(x) are functions.
Activity 2
The sketch represents the graph of the parabola given by f(x) = 2 – x – x2.
Points A, B and C are the intercepts on the axes and D is the turning point of the graph.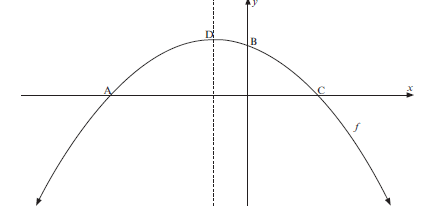
1.1 Determine the co-ordinates of A, B and C. (4)
1.2 Determine the co-ordinates of the turning point D. (3)
1.3 Write down the equation of the axes of symmetry of f(x– 5). (1)
1.4 Determine the values of x for which – f(x) > 0. (2)
[10]
Solutions 1.2 x = –b |
Activity 3
The sketch represents the graph of the parabola given by f(x) = ax2 + bx + c and the straight line defined by g(x) = mx + c
Points A, B ,C and D are the intercepts on the axes. E is the point of intersection of the two graphs.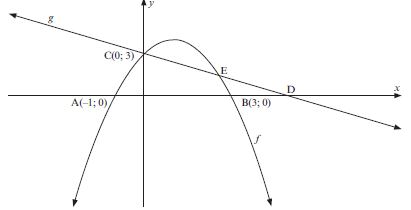
2.1 Write down the co-ordinates of point D if D is the image of B after B has been translated two units to the right. (1)
2.2 Determine the equation of g. (3)
2.3 Determine the equation of the function f in the form f(x) = ax2 + bx + c. (4)
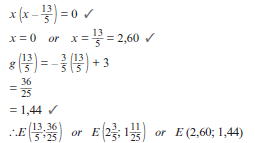
2.4 Determine the coordinates of E. (4)
2.5 Write down the values of x for which f(x) ≥ g(x). (2)
[14]
Solutions 2.4 – 3 /5x + 3 = –x2 + 2x + 3 |
Activity 4
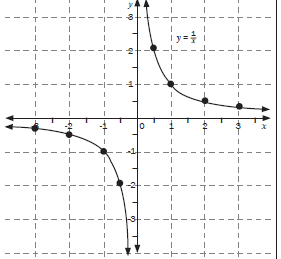
| 1. Sketch the graph of y = 1/x by plotting points. Describe the main features of the graph. (4) Solution a = 1 a > 0, the graph lies in the 1st and 3rd quadrant
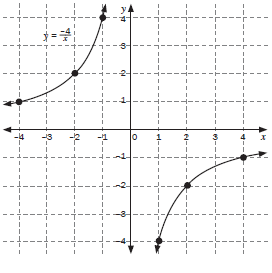
| 2. Sketch the graph of y = –4/x by plotting the points. Describe the main features of the graphs. (4) Solution a = –4 a < 0, the graph lies in the 2nd and 4th quadrant
[8] |
Activity 5
1. Consider the function y = 1/x – 2
1.2 Sketch the graph
Solutions
| 2. Consider the function f(x) = –4/x+ 1
2.2 Sketch the graph Solutions
| ||||||||||||||||||||||||||||||||
1.2
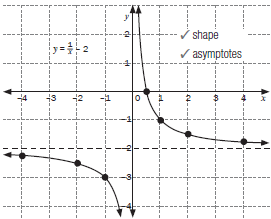 1.3
Compare this graph with the one in activity 4 (a) | 2.2
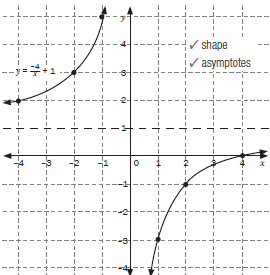 2.3 Domain: x ∈ R; y ≠ 0 Range: y ∈ R; y ≠ 1 2.4 The asymptotes are x = 0 and y = 1 y = –x + c 1 = –(0) + c 1 = c lines are y = –x + 1 and y = 3x + 1 [9] Compare this graph with the one in activity 4 (b) |
Activity 6
- Consider the function f(x) = 2 + 1
x - 3- Write down the equations of the asymptotes of f (2)
- Calculate the coordinates of the x and y-intercepts of f (4)
- Write the domain and range (2)
- Sketch the graph of f clearly showing ALL asymptotes and intercepts with the axes. (3)
- Consider the function f(x) = 3 – 2
x - 1- Write down the equation of the asymptotes. (2)
- Calculate the coordinates of the intercepts of the graph of f with the axes. (3)
- Sketch the graph of f clearly showing the intercepts with the axes and the asymptotes. (3)
- Write down the range of y = –f(x). (1)
- Describe, in words, the transformation of f to g if g(x) = -3 – 2 (2)
x + 1
[22]
Solution
intercepts | Solution
|
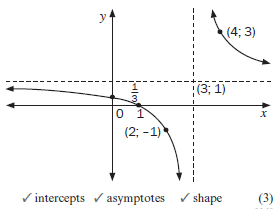
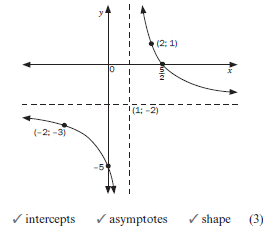
In the graph 1 (d) the points (4; 3), x = 4 was chosen because it has x-coordinate greater than
x = 3 the vertical asymptote. The point (2; –1), was chosen because has x-coordinate x = 2 is
less than x = 3 the vertical asymptote. These points can also be used to help determining in which quadrants the graph must be drawn. The points (2; 1) and (–2; –3) on graph 2 (iii) were chosen similarly.
Activity 7
The diagram below represents the graph of f(x) = a + q. T(5; 3) is a point on f.
x + p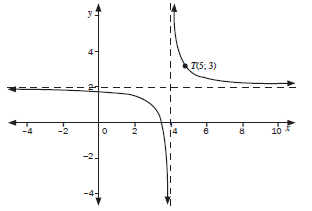
4.1 Determine the values of a, p and q (4)
4.2 If the graph of f is reflected across the line having the equation y = –x + c, the new graph coincides with the graph of y = f(x).
Determine the value of c. (3)
[7]
| Solutions 4.1 p = 4 and q = 2 using the asymptotes Substitute T(5; 3) into y = a + 2 x - 4 3 = a + 2 5 - 4 3 = a + 2 a = 1 (4) 4.2 Substitute (4; 2) 3into y = –x + c 2 = –(4) + c ∴ c = 6 (3) [7] |
Activity 8
Sketched below are the graphs of f(x) = (x + p)2 + q and g(x) = a + c A(2½;0) is a point on the graph of f. P is the turning point of f. The asymptotes of g are
x + b
represented by the dotted lines. The graph of g passes through the origin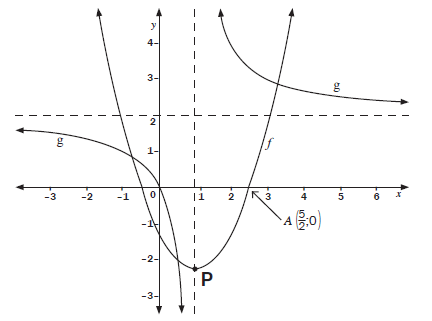
5.1 Determine the equation of g. (4)
5.2 Determine the coordinates of P, the turning point of f. (4)
5.3 Write down the equation of the asymptotes of g(x – 1). (2)
5.4 Write down the equation of h, if h is the image of f reflected about the x–axis. (1)
[11]
Solutions |
Activity 9
The curve of an exponential function is given by f(x) = kx and cuts the y–axis at A (0; 1) while B ( 2:9/4) lies on the curve.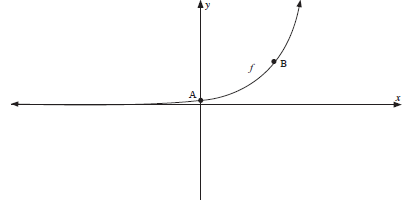
Determine
1.1 the equation of the function f. (3)
1.2 the equation of the asymptote of h if h(x) = –f(x). (2)
1.3 the range of h. (1)
1.4 The equation of the function g of which the curve is the reflection of the curve of f in the line y = x. (2)
| Solutions 1.1 f(x) = kx 9/4 = a2 (3/2)2 = a2 a = 3/2 ∴f(x) = ( 3/2)x (3) 1.2 y = 0 (2) 1.3 y ≤ 0 (1) 1.4 g(x) = log 3/2 x (2) [8] |
Activity 10
-
- If f(x) = –3x2 ,write down the equation for the inverse function in the form y = …................. (2)
- Determine the domain and range of f(x) and f –1 (x) (4)
- Determine the points of intersection of f(x) and f –1 (x) (4)
-
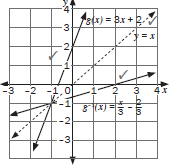
- If g(x) = 3x + 2, find g –1(x) (2)
- Sketch g, g –1 and the line y = x on the same set of axes. (3)
[15]
Solutions
|
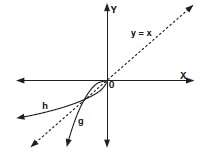
Given: g (x) = – x2 where x < 0 and y < 0
- Write down the inverse of g, g–1 in the form h(x) = ........... (3)
- Sketch the graphs of g, h and y = x on the same set of axis. (4)
Solutions
|
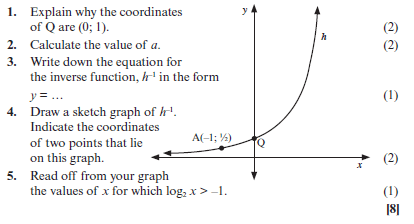
Activity 11
The graph of h(x) = ax is sketched below. A ( –1; ½ ) is a point on the graph of h.
Solutions
|