ElimuZA Access to Education
Monday, 23 August 2021 13:50
INFLATION QUESTIONS AND ANSWERS GRADE 12
Share via Whatsapp Join our WhatsApp Group Join our Telegram GroupActivity 1
Study Figure 12.2 below and answer the questions that follow: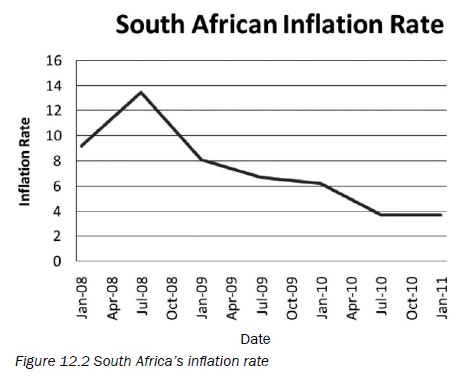
- Define the concept inflation. (2)
- When did the inflation rate peak? (2)
- Do we adhere to the inflation target set by government from July 2010–Jan 2011? Supply figures. (4)
- Explain what you would do to lower the inflation rate in our country? (4)
- Which institutions in South Africa make inflation figures available? (2)
- What, according to you, caused the double figures in April–July 2008? (4)
- Why are these figures in the graph not a reflection of hyperinflation? (4)
[22]
Answers to activity 1
|
Activity 2
Study the cartoon below and answer the questions that follow: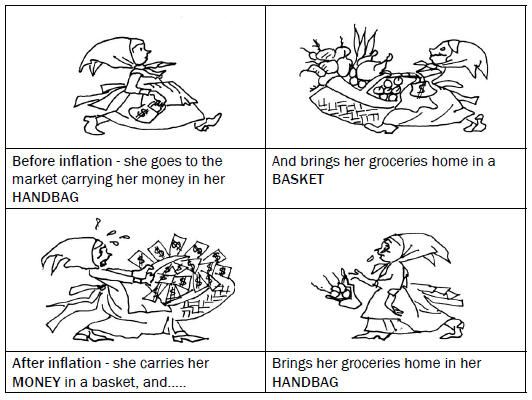
- What is the message behind the cartoon? (2)
- What is happening to the purchasing power of the money? (2)
- In which country is this woman a consumer? Motivate your answer. (4)
[8]
Answers to activity 2
|
Activity 3
Name any THREE fiscal measures to control inflation. (3 × 2) [6]
Answers to activity 3
|
Published in Economics Grade 12 Study Guides and Notes