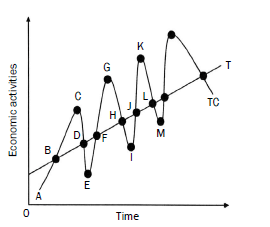
Activity 1 Study Figure 2.5 below and answer the questions that follow Figure 2.5 Business cycles
Define the term business cycle. (3)
Indicate which indicator is represented by T. (2)
What is measured by the horizontal axis? (2)
At which point did the economy reach a peak and a trough? (4)
Identify the four phases into which the business cycle is divided in the above illustration. (8)
How is the length measured in the above business cycle? (2)
Explain lagging and coincident indicators used in the forecasting of business cycles. (2 × 4) (8) [29]
Answers to activity 1
Successive periods of growth and decline in economic activities(3)
Trend line (2)
Time (2)
Peak – C Trough – E (4)
BC – Prosperity CD – Recession DE – Depression EF – Recovery (8)
From C to G or E to I (2)
Lagging indicators These do not change direction until after the business cycle has changed its direction. E.g. hours worked in construction; total number of commercial vehicles sold. Co-incident indicators These move at the same time as the economy They indicate the actual state of the economy. E.g. value of retail sales; real GDP (8) [29]
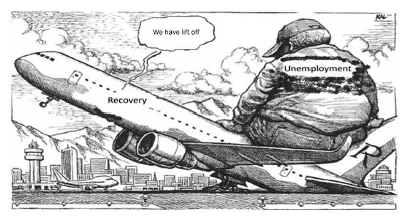
Activity 2 Study the cartoon below and answer the questions that follow:
What is the message behind the cartoon? (2)
Why do you think that unemployment will not lead to an economic lift off? (2)
To which forecasting indicator does unemployment refer? (2)
How would you describe the recovery phase of a typical business cycle? (2) [8]
Illustrate the business cycle struggling to recover due to the burden of unemployment (2)
Due to a high percentage of unemployed people in South Africa (2)
Co-incident (2)
Economic activities start to increase OR Exports will start to increase, resulting in an increase in production (2) [8]
Activity 3 Discuss the monetarist approach as a cause of business cycles. [8]
Answers to activity 3
Exogenous approach
Believe markets are inherently stable.
Departures from the equilibrium state are caused by factors outside of the market system.
Market forces (supply and demand) kick in and bring the economy back to its natural state or equilibrium route.
These interferences are not part of the normal forces operating in the market.
Governments should not interfere in the markets.
Major cause of economic fluctuations are inappropriate government policies 3 undesirable increases and decreases in money supply (maximum 4 marks for examples) [8]
Activity 4 Discuss the trend line in the forecasting of business cycles. [8]
Answers to activity 4
The trend line represents the average position of a cycle.
It indicates the general direction in which the economy is moving.
An upward trend suggests that the economy is growing.
The trend line usually has a positive slope, because production capacity increases over time.
Diagram showing trend line (see Figure 2.1 on page 26 for an example) .