TRIG FUNCTIONS GRADE 12 NOTES - MATHEMATICS STUDY GUIDES
Share via Whatsapp Join our WhatsApp Group Join our Telegram Group- Graphs of trigonometric functions
- The effect of a on the shape of the graph: change in amplitude
- The effect of q on the shape of the graph: vertical shift
- The effect of b on the shape of the graph: change in period
- The effect of p on the shape of the graph: horizontal shift
5.1 Graphs of trigonometric functions
Graph 1. The sine function: y = a sinb (x + p) + q
e.g. 1
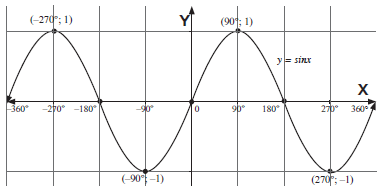
Sketch the graph of y = sin x for x
- We can make use of a table or a calculator to determine the critical points on the graph.
- The endpoints of the domain must be included i.e. x = −360° and x = 360°
- All intercepts with the x and y axis must be indicated as well as all minimum and maximum points (turning points)
Solution
|
To ensure that all the critical values are indicated on the graph, we have to use the correct x-values.
If y = a sinbx, then 90º/b will give us the intervals we have to use from 0. In our example b = 1, therefore 90º/1 = 90º.
Therefore we will use x-values of (00,90º, 180º, 270o, 360o etc) If we use a calculator, we will use 90 as the “step”.
Domain: all the possible x values on the graph
Range: all the possible y-values on the graph
Amplitude: the maximum distance from the equilibrium position
Period: number of degrees to complete a wave or a cycle.
Activity 1
Use the graph y = sin x above to answer these questions:
- What are the maximum and minimum values of y = sin x? (2)
- Write down the domain and the range of y = sin x. (4)
- Write down the x-intercepts of y = sin x. (2)
- What is the amplitude of the graph of y = sin x? (1)
- What is the period of the graph of y = sin x? (1)
[10]
| Solutions | ||
| y = sinx | ||
| 1 | Maximum Values | 1 , at x = –270° and 90° |
| Minimum Values | –1, at x = –90° and 270° (2) | |
| 2 | Domain | x ∈ [− 360°;360°], x ∈ ℝ |
| Range | [–1; 1] y ∈ ℝ (4) | |
| 3 | x-intercepts | –360°, –180°, 0°, 180° and 360° (2) |
| 4 | Amplitude | 1(1) |
| 5 | Period | 360° (1) |
| [10] | ||
Graph 2. The cosine function:
y = a cos b(x + p) + q
e.g. 2
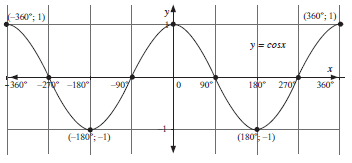
Sketch the graph of y = cos x for x ∈ [–360°;360°]
- We can make use of a table or a calculator to determine the critical points on the graph.
- The endpoints of the domain must be included i.e. x = –360° and x = 360°
- All intercepts with the x and y axis must be indicated as well as all minimum and maximum points (turning points)
| x | –360° | –270° | –180° | –90° | 0° | 90° | 180° | 270° | 360° |
| y | 1 | 0 | -1 | 0 | 1 | 0 | -1 | 0 | 1 |
To ensure that all the critical values are indicated on the graph, we have to use the correct x-values.
If y = acosbx, then 90º/b will give us the intervals we have to use from 0°. In our example b = 1, therefore 90º/1 = 900.
Therefore we will use x-values of (00,900, 1800, 270o, 360o etc)
If we use a calculator, we will use 900 as the “step”.
| y = cos x | ||
| 1 | Maximum Values | 1, at x = 0° and 360° |
| 2 | Minimum Values | –1, at x = –180° and 180° |
| 3 | x-intercepts | –270°, –90°, 90° and 270°. |
| 4 | Amplitude | 1 |
| 5 | Period | 360° |
| 6 | Domain | x ∈ [− 360°;360°], x ∈ R |
| 7 | Range | [–1; 1] y ∈ R |
Graph 3. The tangent function:
y = a tan b(x + p) + q
e.g.3
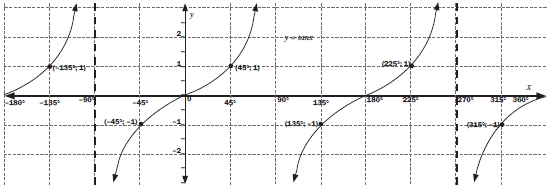
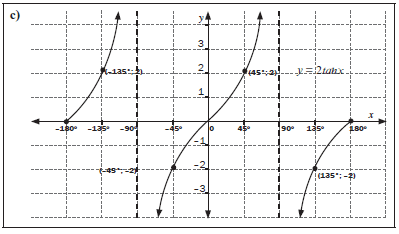
Sketch the graph of y = tan x for x ∈ [− 180°;180°]
- All intercepts with the x and y axis must be indicated.
- The endpoints of the domain must be included i.e. x = − 180°and x = 360°
- The equations of the asymptotes must be written on the graph.
| Solution | |||||||||||||
| x | –180° | –135° | –90° | –45° | 0° | 45° | 90° | 135° | 180° | 225° | 270° | 315° | 360° |
| y | 0 | 1 | undefined | -1 | 0 | 1 | undefined | -1 | 0 | 1 | undefined | -1 | 0 |
| y = tanx | ||
| 1 | Asymptotes | x = –90°, x = 90° and x = 270° |
| 2 | x-intercepts | –180°, 0°, 180° and 360°. |
| 3 | Period | 180° |
| 4 | Domain | x ∈ [− 180°;360°], x ∈ R |
| 5 | Range | (–∞; ∞). y ∈ R |
To ensure that all the critical values are indicated on the graph, we have to use the correct x-values.
If y = atanbx, then 45º/b will give us the intervals we have to use from 0. In our example b = 1, therefore 45º/1 = 45º.
Therefore we will use x-values of (0º,45º, 90º, 135º etc) If we use a calculator, we will use 45º as the “step”
5.2 The effect of a on the shape of the graph: change in amplitude
e.g.4
- Sketch the following graphs:
- on the same set of axes
y = –sin x and y = 2sin x for x ∈ [–360°; 360°], - on the same set of axes
y = –2 cos x and y = ½ cos x for x ∈ [–360°; 360°], - y = 2 tan x for x ∈ [–180°; 180°],
- on the same set of axes
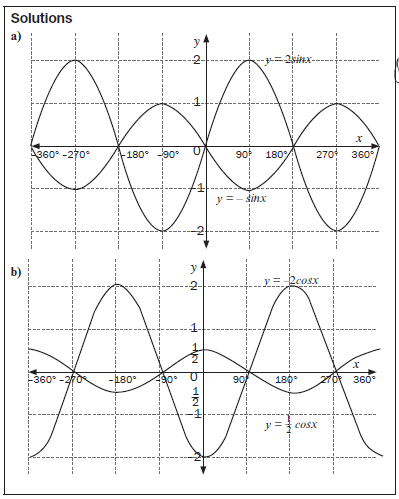
y = -1sinx ….
Amplitude = 1
y = 2sinx….Amplitude = 2
y = sinx…Amplitude = 1
y = asinbx…..Amplitude = a
(The amplitude value is always positive, irrespective if a is negative..
Example: if a = -2, then the amplitude is 2.
The parameter a changes the amplitude of the graph.
y = –2 cosx ...
Amplitude = 2
y = ½cosx ... Amplitude = ½
y = cosx ... Amplitude = 1
y = acosbx ... Amplitude = a
The parameter a changes the amplitude of the graph.
Conclusion
The parameter a changes the amplitude of the graph in y = asinbx and y = acosbx.
The graph y = atanbx has no maximum or maximum value. The value does not change the amplitude of y = atanbx as there is no amplitude.
The value of a affects the y-value of each point.
Each y-value is multiplied by a.
Related Items
5.3 The effect of q on the shape of the graph: vertical shift
Consider the graphs of y = sin x + q, y = cos x + q and y = tan x + q.
e.g.5
1. Sketch the following graphs on the same set of axes for the domain [–360°; 360°]:
- y = –sin x and y = – sin x + 1
- y = cos x, y = cos x + 1, y = cos x – 2
- y = tan x and y = tan x + 1
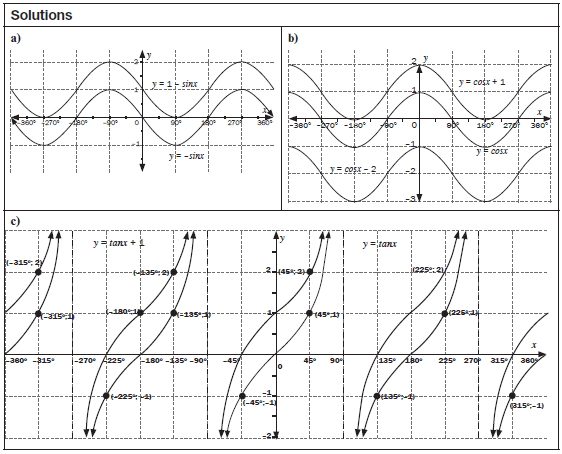
Conclusion
The parameter q shifts the whole graph up or down by q units.
5.4 The effect of b on the shape of the graph: change in period
Consider the graphs of y = sin bx, y = cos bx and y = tan bx.
e.g.6
- Draw the graphs on separate set of axes:
- y = sin 2x for x ∈ [–90°, 180°]
- y = cos 3x for x ∈ [0°; 360°]
- y = tan ½ x for x ∈ [–360°; 360°]
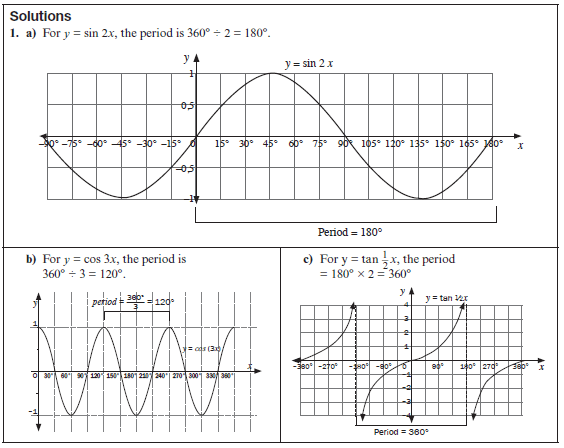
Conclusion
- The period of the graph is the number of degrees it takes to complete one wavelength.
- The value of b, affects the period of the graph
- For y = sin bx and y = cosbx, the period = 360º/b
- For y = tan bx, the period = 180º/b
5.5 The effect of p on the shape of the graph: horizontal shift
Consider the graphs of the form y = sin (x + p), y = cos (x + p) and y = tan (x + p).
e.g.7
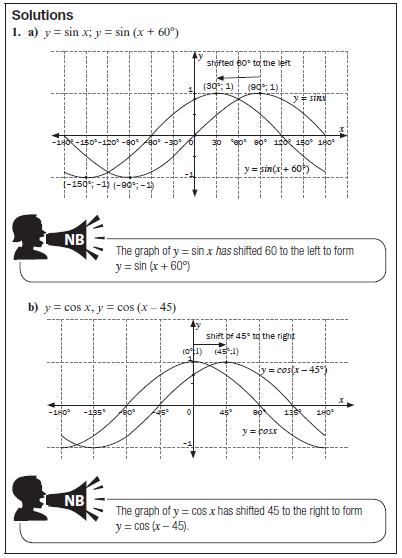
- Draw the following graphs on the same set of axes and for x ∈ [–180°, 180°]:
- y = sin x and y = sin (x + 60°)
- y = cos x and y = cos (x – 45°)
- y = tan x and y = tan (x + 45°)
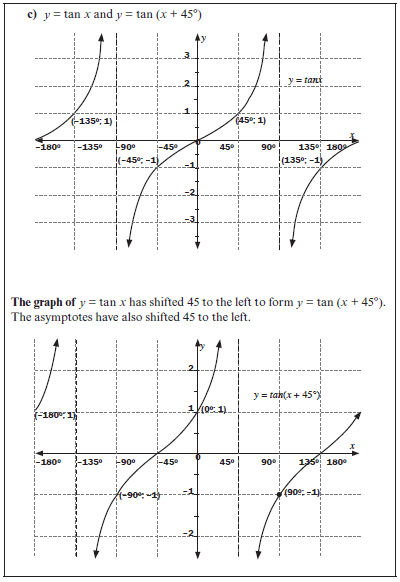
Conclusion
For graphs of the form y = sin (x + p), y = cos (x + p) and y = tan (x + p),
p affects the horizontal shift of the graph.
- If p > 0 (positive), the graph moves p degrees to the left.
- If p < 0 (negative), the graph moves p degrees to the right.
- In all graphs the x-intercepts, y-intercepts, maximum and minimum points must be indicated on the graph. If the value of b changes, the x-intercepts, y-intercepts, maximum and minimum points also change. In order to ensure that these points are always indicated, use the following x-values for plotting the graph:
| Equation | b=1 | b=2 | b=3 | b=½ |
| y = sinbx or y = cosbx | From 0°, use intervals of 90° Interval = 90º/b Period = 360º/b | From 0°, use intervals of 45° Interval = 90º/b Period = 360º/b | From 0°, use intervals of 30° Interval = 90º/b Period = 360º/b | From 0°, use intervals of 180° Interval = 90º/b Period = 360º/b |
| y = tanbx | From 0°, use intervals of 45° Interval = 45º/b Period = 180º/b | From 0°, use intervals of 22,5° Interval = 45º/b Period = 180º/b | From 0°, use intervals of 15° Interval = 45º/b Period = 180º/b | From 0°, use intervals of 90° Interval = 45º/b Period = 180º/b |
| y = sin(x+p) or y = cos(x+p) | From 0°, use intervals of (90°– p°). with p > 0 The intervals for y = sin(x – 30) and y = sin(x + 30) will be the same. The intervals will be 90 – 30=60 | |||
| y = tan(x+p) | From 0°, use intervals of (45°– p°). with p>0 The intervals for y = tan(x – 30) and y = tan(x + 30) will be the same. The intervals will be 45 – 30 = 15. |
Activity 2
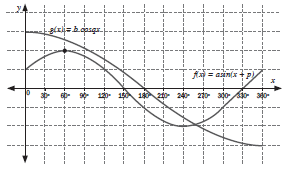
- Given f(x) = 2cos x and g(x) = sin (x + 30°)
- Sketch the graphs of f and g on the same set of axes for x ∈ [− 150°; 180°]
Clearly show all intercepts with the axes and the coordinates of turning points. (7)
Use your graph to answer the following questions: - Write down the period of f. (1)
- For which values of x is f(x) = g(x)? (2)
- For which values of x is f(x) > 0? (2)
- For which values of x is g(x) increasing? (2)
- Determine one value of x for which f(x) − g(x) = 1,5. (1)
- If the curve of f is moved down one unit, write down the new equation of f. (2)
- If the curve of g is moved 45° to the left, write down the new equation of g. (2)
- Sketch the graphs of f and g on the same set of axes for x ∈ [− 150°; 180°]
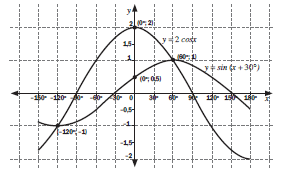
- Sketch below are the graphs of g(x) = asin(x+p) and f(x) = bcosqx for x ∈ [0°; 180°]

- Determine the numerical values of a, p, b and q. (5)
- If the graph of g(x) is shifted two units down:
- Write down the amplitude of the new graph (1)
- Write down the equation of the new graph (2)
- If the graph of f(x) is shifted 60 to the left, write down two possible equations of the new graph. (2)
[29]
Solutions
|
What you need to be able to do
- Recognise the basic shapes of the graphs associated with their equations.
- Sketch functions and show the effect of different parameters a, p and q.
- Draw each graph using the critical points: intercepts with the axes and turning points, where applicable
- Show any asymptotes and include any other points you might need.
- Determine the features of graphs including
- domain and range of functions
- turning points
- asymptotes
- intercepts with axes
- Find the equation from the graph.
- Sketch trig functions, any shifts and changes in amplitude and period.
In Unit 10, we will discuss the solutions to trigonometric equations. You will be shown how to determine the solution of 2cosx=sin(x+30) algebraically. In this question the solutions can be read off the graphs.