FUNCTIONS GRADE 12 NOTES - MATHEMATICS STUDY GUIDES
Share via Whatsapp Join our WhatsApp Group Join our Telegram Group- What is a function?
- Function notation
- The basic functions, formulas and graphs
- Inverse functions
- The logarithmic function
4.1 What is a function?
If you are given a set of x-values, you can work out the set of y-values or answers that came from using a given rule on each x-value.
So there is a relationship between the x-values and the y-values that is described by the rule.
The x-values are the input values and the y-values are the output values. In this flow diagram, the rule is y = 2x – 1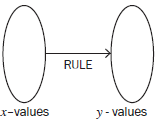
So for every x-value, we multiply it by 2 and subtract 1 to find the corresponding y-value.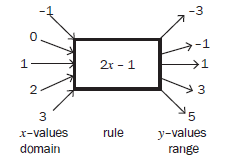
The input values or x-values are the elements of the domain of this set and the output values or y-values are the elements of the range of this set.
We can plot these values on the Cartesian plane.
If we extend the domain so that x∈핉, we get the graph for y = 2x – 1.
Look at the graph. For every x-value on this graph, there is only one y-value. If a rule or a formula produces only one y-value for each x-value, then we have a function.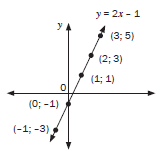
A function is a relationship between x and y, where for every x-value there is only one y-value.
One way to decide whether or not a graph represents a function is to use the vertical line test.
If any line drawn parallel to the y-axis cuts the graph only once, then the graph represents a function.
e.g 1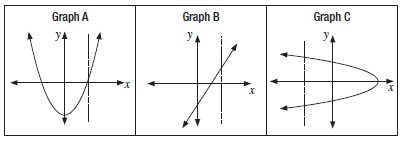
Graph A and Graph B are functions.
Graph C is not a function because the vertical cuts the graph twice. So for an x-value on the graph, there are two y-values.
4.2 Function notation
We use function notation f(x) to show that each y-value is a function of an x-value.
We can also use other letters too, such as g(x), h(x), etc.
So y = 2x – 1 can be written as f(x) = 2x – 1.
The value of f(x) for any x-value can be worked out by substitution:
For example, at x = –3 we can find f(–3) = 2(–3) – 1 = - 7
So the point (–3; –7) lies on the graph of f(x) = 2x – 1
Activity 1
- If h(x) = (½)x determine the value of h(–4). (3)
- If the function g(x) = – x2 –3x, find g(x + h) (2)
- If f(x) = 4x + 1, determine the value of:
3.1 f(x + a)
3.2 f(x) + a
3.3 af(x) (3) - If g(x) = 2x2, determine the value of:
4.1 g(–x)
4.2 –g(x) (2)
[10]
Solutions
|
In each example, there is only one possible y-value for each x-value, so f(x); h(x) and g(x) are functions.
4.3 The basic functions, formulas and graphs
Important terms to remember:
Domain: the set of possible x-values
Range: the set of possible y-values
Axis of symmetry: an imaginary line that divides a graph into two mirror images of each other.
Maximum: the highest possible y-value of a function.
Minimum: the lowest possible y-value of a function.
Asymptote: an imaginary line that a graph approaches but never touches.
Turning point: The point at which a graph reaches its maximum or minimum value and changes direction.
4.3.1 The linear function (straight line)
Linear functions have the form f(x) = ax + q where a represents the gradient of a straight-line graph and q represents the y-intercept when x = 0.
The graph of y is a straight line with a = 1 and q = 0
Domain: x ∈ R
Range: y ∈ R
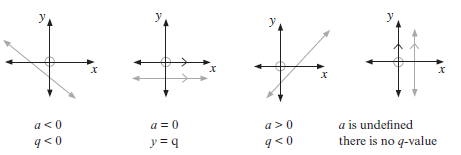
Also note the shape of the following linear functions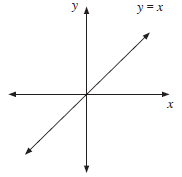
SKETCHING THE LINEAR FUNCTION
To sketch the linear function using the dual intercept method.
- Determine the x-intercept (let y = 0)
- Determine the y-intercept (let x = 0)
- Plot these two points and draw a straight line through them.
DETERMINING THE EQUATION OF A LINEAR FUNCTION
To determine the equation of the linear function follow the following steps:
- Determine the gradient of the function.
- Substitute the value of the gradient into the general formula for the linear function.
- Solve for q.
- Write the equation in the form f(x) = ax + q
e.g 2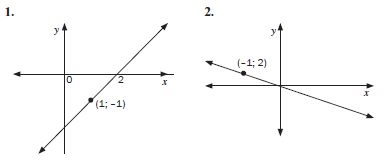
Solutions
|
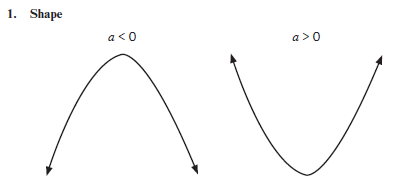
4.3.2 The quadratic functions (parabola)
A quadratic function is a parabola and can be represented with a general formula y = ax2 + bx + c or y = a(x + p)2 + q
[PROPERTIES OF A PARABOLA]
SKETCHING THE QUADRATIC FUNCTION
To sketch any quadratic function, follow the following steps:
- Write down the y-intercept (let x = 0)
- To calculate the x-intercepts,
- Write the equation in the form ax2 + bx + c = 0
- Factorise the left hand side of the equation.
- Use the fact that if (x – p)(x – q) = 0, then x = p or x = q, to calculate the x-intercepts.
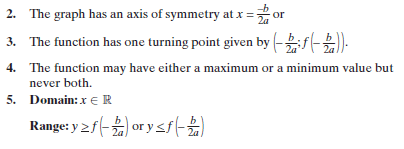
- Determine the axis of symmetry.
- Substitute the x-value of the axis of symmetry into the original equation of the function to calculate the co-ordinates of the turning point.
- Plot the points and then draw the function using free hand.
e.g. 3
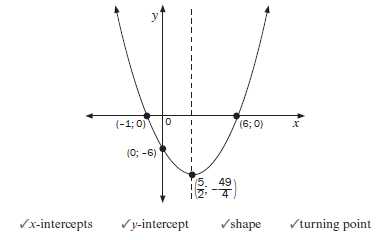
Sketch the graph of f(x) = x2 – 5x – 6
- y-intercept
f(0) = –6
Therefore the co-ordinates of the y-intercept are (0; –6) 3 - x-intercept
x2 – 5x – 6 = 0 3
(x – 6)(x + 1) = 0 3
x = 6 or x = –1 3
(6; 0) and (–1; 0) - Axis of symmetry
x = – b
2a
= –(–5)
2(1)
= 5
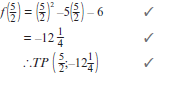
2 - Turning point

- Sketch Graph

Determining the equation of a quadratic function
| Given the x-intercept and one point | Given the turning point and one point |
|
|
| Given the co-ordinates of three points on the parabola | |
| |
Nature of the roots and the quadratic function
| Nature of roots | Quadratic function |
| Real roots Δ > 0 | 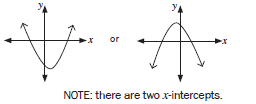 |
| Equal roots Δ = 0 | 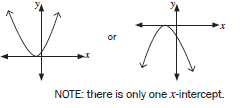 |
| Non-real roots Δ > 0 | 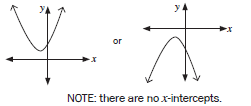 |
Activity 2
The sketch represents the graph of the parabola given by f(x) = 2 – x – x2.
Points A, B and C are the intercepts on the axes and D is the turning point of the graph.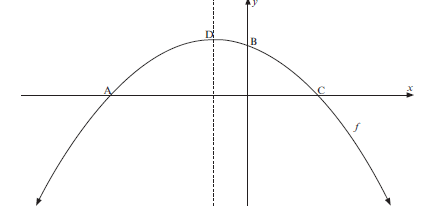
1.1 Determine the co-ordinates of A, B and C. (4)
1.2 Determine the co-ordinates of the turning point D. (3)
1.3 Write down the equation of the axes of symmetry of f(x– 5). (1)
1.4 Determine the values of x for which – f(x) > 0. (2)
[10]
Solutions 1.2 x = –b |
Activity 3
The sketch represents the graph of the parabola given by f(x) = ax2 + bx + c and the straight line defined by g(x) = mx + c
Points A, B ,C and D are the intercepts on the axes. E is the point of intersection of the two graphs.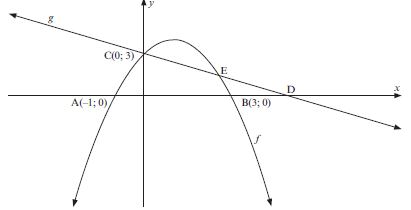
2.1 Write down the co-ordinates of point D if D is the image of B after B has been translated two units to the right. (1)
2.2 Determine the equation of g. (3)
2.3 Determine the equation of the function f in the form f(x) = ax2 + bx + c. (4)
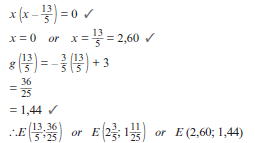
2.4 Determine the coordinates of E. (4)
2.5 Write down the values of x for which f(x) ≥ g(x). (2)
[14]
Solutions 2.4 – 3 /5x + 3 = –x2 + 2x + 3 |
4.3.3 The hyperbolic function
Hyperbola of the form y = a or xy = a where a ≠ 0; x ≠ 0; y ≠ 0.
Properties
Shape

-
- Domain : x ∈ R; x ≠ 0
- Range: y ∈ R; y ≠ 0
- The horizontal asymptote is the x-axis
- The vertical asymptote is the y-axis
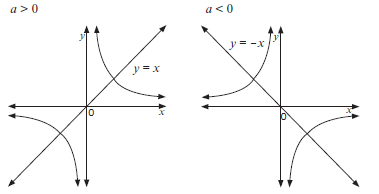
- If a < 0, the graph lies in the 2nd and 4th quadrant
- If a > 0 , the graph lies in the 1st and 3rd quadrant
- The lines of symmetry are: y = x and y = –x.
SKETCHING THE HYPERBOLA OF THE FORM:
y = a or xy = a
x
- The graph does not cut the x-axis and the y-axis (asymptotes)
- Use the table and consider both the negative and positive x-values
- a determine two quadrants where the graph will be drawn
Activity 4
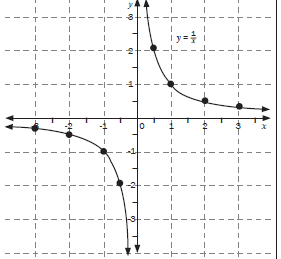
| 1. Sketch the graph of y = 1/x by plotting points. Describe the main features of the graph. (4) Solution a = 1 a > 0, the graph lies in the 1st and 3rd quadrant
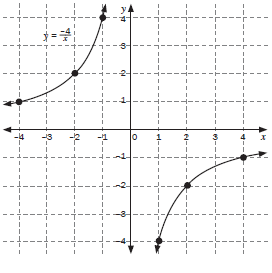
| 2. Sketch the graph of y = –4/x by plotting the points. Describe the main features of the graphs. (4) Solution a = –4 a < 0, the graph lies in the 2nd and 4th quadrant
[8] |
4.3.4 The hyperbola
Hyperbola of the form y = a/x + q is the translation of the graph of y = a/x vertically by q units.
The Horizontal asymptote (x–axis) will also shift q units vertically (up or down).
Activity 5
1. Consider the function y = 1/x – 2
1.2 Sketch the graph
Solutions
| 2. Consider the function f(x) = –4/x+ 1
2.2 Sketch the graph Solutions
| ||||||||||||||||||||||||||||||||
1.2
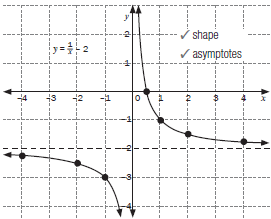 1.3
Compare this graph with the one in activity 4 (a) | 2.2
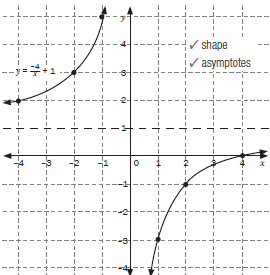 2.3 Domain: x ∈ R; y ≠ 0 Range: y ∈ R; y ≠ 1 2.4 The asymptotes are x = 0 and y = 1 y = –x + c 1 = –(0) + c 1 = c lines are y = –x + 1 and y = 3x + 1 [9] Compare this graph with the one in activity 4 (b) |
4.3.5 Hyperbola of the form
y = a + q where a ≠ 0, x ≠ 0, y ≠ 0
x + p
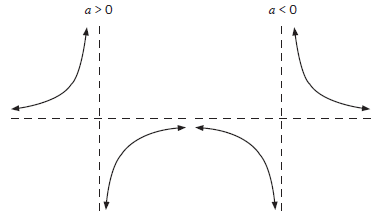
- Shape

The dotted lines are the asymptotes - Domain: x ∈ R; x ≠ –p. Range: y ∈ R; y ≠ q
- The horizontal asymptote is y = q
- The vertical asymptote is x + p = 0 ∴x = –p
- The lines of symmetry are y = x + c and y = x + c
e.g. 4
Consider g(x) = 8 –3 has the horizontal asymptote at y = –3 and x – 2 ≠ 0 ∴x ≠ 2 because if x = 2 the denominator of the expression 8 would be 8 = 8
x + 2 x - 2 2 - 2 0
which is undefined because the denominator is zero.
Thus the graph is undefined for x – 2 = 0 ∴ x = 2 is the vertical asymptote
The graph y = 8/x shift 2 units to the right and 3 units down to form the graph g(x) = 8 - 3
x - 2
SKETCHING THE HYPERBOLA OF THE FORM
y = a + q
x + p
- Write down the asymptotes
- Draw the asymptotes on the set of axes as dotted lines
- Use a to determine the two quadrants where the graph will be drawn
- Determine the x – intercept(s) let y = 0
- Determine the y – intercept(s) let x = 0
- Plot the points and then draw the graph using free hand
Activity 6
- Consider the function f(x) = 2 + 1
x - 3- Write down the equations of the asymptotes of f (2)
- Calculate the coordinates of the x and y-intercepts of f (4)
- Write the domain and range (2)
- Sketch the graph of f clearly showing ALL asymptotes and intercepts with the axes. (3)
- Consider the function f(x) = 3 – 2
x - 1- Write down the equation of the asymptotes. (2)
- Calculate the coordinates of the intercepts of the graph of f with the axes. (3)
- Sketch the graph of f clearly showing the intercepts with the axes and the asymptotes. (3)
- Write down the range of y = –f(x). (1)
- Describe, in words, the transformation of f to g if g(x) = -3 – 2 (2)
x + 1
[22]
Solution
intercepts | Solution
|
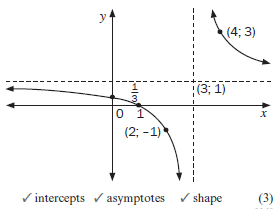
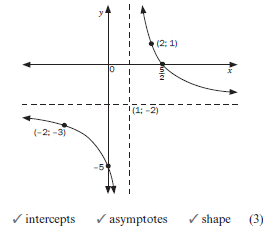
In the graph 1 (d) the points (4; 3), x = 4 was chosen because it has x-coordinate greater than
x = 3 the vertical asymptote. The point (2; –1), was chosen because has x-coordinate x = 2 is
less than x = 3 the vertical asymptote. These points can also be used to help determining in which quadrants the graph must be drawn. The points (2; 1) and (–2; –3) on graph 2 (iii) were chosen similarly.
Activity 7
The diagram below represents the graph of f(x) = a + q. T(5; 3) is a point on f.
x + p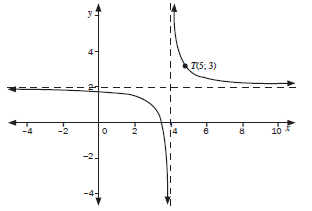
4.1 Determine the values of a, p and q (4)
4.2 If the graph of f is reflected across the line having the equation y = –x + c, the new graph coincides with the graph of y = f(x).
Determine the value of c. (3)
[7]
| Solutions 4.1 p = 4 and q = 2 using the asymptotes Substitute T(5; 3) into y = a + 2 x - 4 3 = a + 2 5 - 4 3 = a + 2 a = 1 (4) 4.2 Substitute (4; 2) 3into y = –x + c 2 = –(4) + c ∴ c = 6 (3) [7] |
Activity 8
Sketched below are the graphs of f(x) = (x + p)2 + q and g(x) = a + c A(2½;0) is a point on the graph of f. P is the turning point of f. The asymptotes of g are
x + b
represented by the dotted lines. The graph of g passes through the origin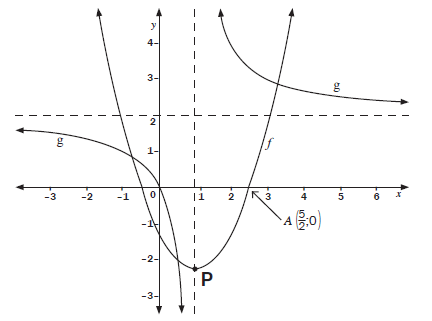
5.1 Determine the equation of g. (4)
5.2 Determine the coordinates of P, the turning point of f. (4)
5.3 Write down the equation of the asymptotes of g(x – 1). (2)
5.4 Write down the equation of h, if h is the image of f reflected about the x–axis. (1)
[11]
Solutions |
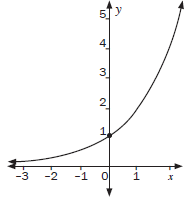
4.3.6 The exponential function
An exponential function can be represented with a general formula y = abx+p + q; b > 0
Shape and properties of an exponential function
| y = bx; b > 1 | y = bx; 0 < b > 1 |
 |  |
|
|
| NOTE: The two functions are a reflection of each other about the y-axis. | |
e.g. 5
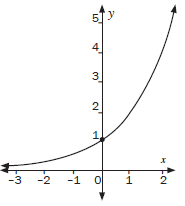
Given: f(x) = 2x
1.1 Draw the graph of f(x) = 2x, show at least three points on the sketch.
1.2 Draw, on the same system of axes the graph of f –1, the inverse of f.
1.3 Write down the equation of f –1 in the form y = ...
Solutions
Then plot the graph using the points |
e.g. 6
The sketch represents the graph given by f(x) = ax.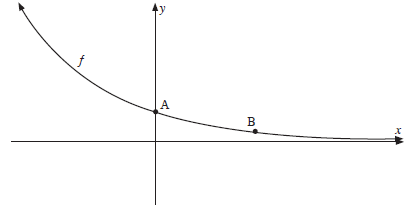
2.1 Write down the coordinates of point A. (1)
2.2 How can we tell that 0 < a < 1? (1)
2.3 Determine a if B is the point ( 3;1/27) . (2)
2.4 Determine the equation of the graph obtained if f is reflected about the y–axis. (2)
2.5 What are the coordinates of the point of intersection of the two graphs? (1)
[7]
| Solutions 2.1 A(0; 1) 2.2 Because the graph is a decreasing function. 2.3 f(x) = ax 1/27 = a3 (3 –1)3 = a3 a = 1/3 2.4 f(x) = (1/3 )x y = (1/3)x becomes y = (1/3 )-x ∴y = ( 3 –1 ) –x y = 3x 2.5 (0; 1) [7] |
Activity 9
The curve of an exponential function is given by f(x) = kx and cuts the y–axis at A (0; 1) while B ( 2:9/4) lies on the curve.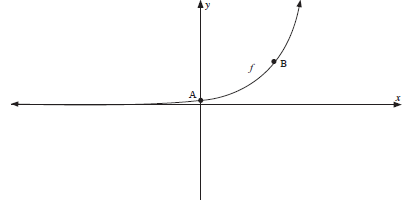
Determine
1.1 the equation of the function f. (3)
1.2 the equation of the asymptote of h if h(x) = –f(x). (2)
1.3 the range of h. (1)
1.4 The equation of the function g of which the curve is the reflection of the curve of f in the line y = x. (2)
| Solutions 1.1 f(x) = kx 9/4 = a2 (3/2)2 = a2 a = 3/2 ∴f(x) = ( 3/2)x (3) 1.2 y = 0 (2) 1.3 y ≤ 0 (1) 1.4 g(x) = log 3/2 x (2) [8] |
4.4 Inverse functions
- The inverse of a function takes the y-values (range) of the function to the corresponding x-values (domain) and vice versa. Therefore the x and y values are interchanged.
- The function is reflected along the line y = x to form the inverse.
- The notation for the inverse of a function is f –1.
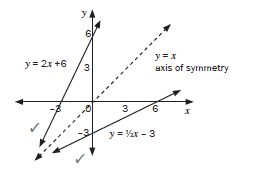
e.g. 7
Given f(x) = 2x + 6.
- Determine f –1(x)
- Sketch the graphs of f(x), f –1 (x) and y = x on the same set of axis
Solutions
|
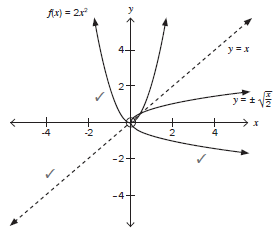
e.g. 8
-
- Sketch f(x) = 2x2
- Determine the inverse of f(x)
- Sketch f –1(x) and y = x on the same axes as f(x)
Solution
|
Activity 10
-
- If f(x) = –3x2 ,write down the equation for the inverse function in the form y = …................. (2)
- Determine the domain and range of f(x) and f –1 (x) (4)
- Determine the points of intersection of f(x) and f –1 (x) (4)
-
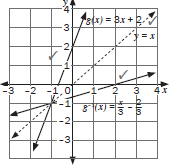
- If g(x) = 3x + 2, find g –1(x) (2)
- Sketch g, g –1 and the line y = x on the same set of axes. (3)
[15]
Solutions
|
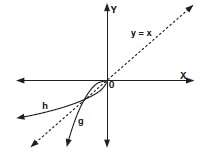
Given: g (x) = – x2 where x < 0 and y < 0
- Write down the inverse of g, g–1 in the form h(x) = ........... (3)
- Sketch the graphs of g, h and y = x on the same set of axis. (4)
Solutions
|
4.5 The logarithmic function
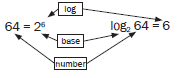
- y = logxa is a logarithmic function with a = log number, x=log base
- y = logxa Reads “y is equal to log a base x”
- The logarithmic function is only defined if a > 0, a ≠ 1 and x > 0
- An exponential equation can be written as a logarithmic equation and vice versa
e.g. 9
Write each of the following exponential equations as logarithmic equations:
- 26 = 64
- 5³ = 125
Solutions
|
e.g. 10
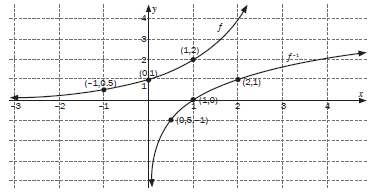
Given: f(x) = 2x
- Determine f –1 in the form y = ……
- Sketch the graphs of f(x), f –1 (x) and y = x on the same set of axes.
- Write the domain and range of f (x) and f –1 (x)
The inverse of the exponential function y = ax is x = ay In order to make y the subject of the formula, x = ay, we use the log function. y = log ax is the inverse of y = ax.
Solutions
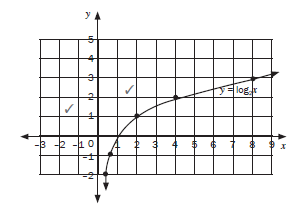
Make a table for y = log2 x
|
Let’s compare the two graphs on the Cartesian plane.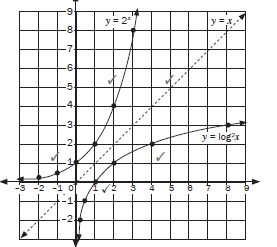
The graph of y = log2 x is a reflection about the y = x axis of the exponential graph of y = 2x.
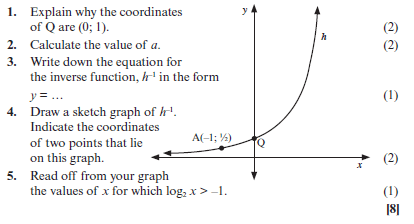
Activity 11
The graph of h(x) = ax is sketched below. A ( –1; ½ ) is a point on the graph of h.
Solutions
|
What you need to be able to do:
- Understand the concept of the inverse of a function and find the equations of the inverses.
- The line y = x is the line of symmetry of the function and the inverse of the function
- The logarithmic function and the exponential function are inverse functions of each other.
- If the inverse is not a function, restrict the domain of a function in order to make the inverse a function
- Identify axes of symmetry for parabolas and hyperbolas
- Sketch the graphs of different functions using their characteristics e.g. asymptotes, x- and y –intercepts and turning points
- Determine the functions equations from a graph
- Solve problems involving two or more graphs
- Understand the concept of the inverse of a function and the equation of the inverses
- The line y = x is the line of symmetry of the function and the inverse of the function
- The logarithmic functions and the exponential function are inverse function of each other
- If the inverse is not a function, restrict the domain of a function in order to make the inverse a function.