Grade 12 Tourism Data Handling Task 2021
Share via Whatsapp Join our WhatsApp Group Join our Telegram GroupTOURISM
DATA HANDLING TASK
GRADE 12
2021
Unforeseen Occurence - Covid 19 Pandemic and its influence on the Tourism Industry of South Africa
TEACHER INSTRUCTIONS
Skills included in the task:
Every Grade 12 Tourism teacher is expected to draw up a marking guideline. Please DO NOT use any marking guidelines or resources from the internet or social media, do NOT buy from any other source - this poses a significant danger that the task will be declared invalid. Developing your own marking guideline, will enable you to better prepare your learners for the task BEFORE the scheduled assessment session takes place. OVERVIEW |
 | TOURISM DATA HANDLING TASK GRADE 12 2021 ASSESSMENT INSTRUMENT |  |
1.1 Study the graph obtained from Statistics South Africa (Stats SA) below and answer the questions that follow.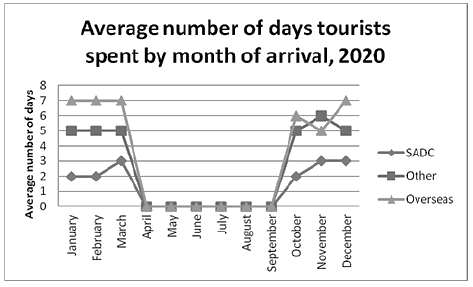
1.1.1 Determine the FOUR months in which overseas tourists spent the highest number of days in South Africa. (4)
1.1.2 Provide ONE reason for your answer to QUESTION 1.1.1 (2)
1.1.3 Suggest ONE reason for the trend displayed during the period April to September 2020. (2)
[8]
1.2 1.2 Study the statistics in the table below and answer the questions that follow.
| TOTAL NUMBER OF FOREIGN TRAVELERS AND SOUTH AFRICAN RESIDENTS BY YEAR OF TRAVEL, 2016-2020 | ||||||||
| Year | South African residents | Foreign travellers | ||||||
| Arrivals | Departures | Transits | Total | Arrivals | Departures | Transits | Total | |
| 2016 | 5 477 607 | 5 550 904 | 9855 | 11 038 366 | 16 158 419 | 14 631 003 | 823 974 | 31 613 396 |
| 2017 | 5 785 699 | 5 785 699 | 9617 | 11 508 449 | 15 990 598 | 14 553 540 | 753 433 | 31 297 571 |
| 2018 | 5 936 987 | 6 014 912 | 9511 | 11 961 401 | 15 939 855 | 14 264 702 | 751 197 | 30 955 754 |
| 2019 | 6 003 568 | 6 076 274 | 9777 | 12 089 619 | 15 825 296 | 14 043 589 | 811 663 | 30 680 548 |
| 2020 | 1 828 049 | 1 623 702 | 1956 | 3 453 707 | 4 586 387 | 4 115 835 | 140 871 | 8 843 093 |
1.2.1 Refer to South African residents:
- Determine the number of departures of South African residents in 2019. (2)
- Determine the number of departures of South African residents in 2020. (2)
- Calculate the percentage decrease in the number of departures of South African residents in 2020 when compared to 2019. Show ALL steps of your calculation. (4)
1.2.2 Refer to foreign travellers:
- Determine the number of foreign arrivals to South Africa in 2019. (2)
- Determine the number of foreign arrivals to South Africa in 2020. (2)
- Calculate the percentage decrease in the number of foreign arrivals to South Africa in 2020 when compared to 2019.
Show ALL steps of your calculation. (4)
1.2.3 Refer to your answers to QUESTIONS 1.2.1 (c) and 1.2.2 (c).
Write a paragraph explaining your findings. (4)
[20]
1.3 Study the table below showing the income of the food and beverage sector in South Africa during 2019 and 2020 and answer the questions that follow.
| ANNUAL INCOME OF THE FOOD AND BEVERAGE SECTOR IN SOUTH AFRICA 2019 AND 2020 | ||
| Categories of Food and Beverages | Jan-Dec 20 | Jan – Dec 19 |
| Catering services (R million) | 4 426.40 | 8 473.50 |
| Take-away and Fast-Food Outlets (R million) | 14 477.90 | 18 411.10 |
| Restaurants and Coffee Shops (R million) | 14 802.30 | 29 742 |
| Total Industry (R million) | 33 706.60 | 56626.60 |
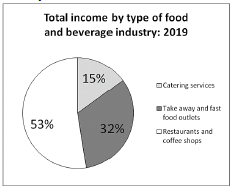
1.3.1 Use the information in the table above to draw a pie chart of the annual income of the Food and Beverage Sector during 2020 according to the criteria below. Show all your calculations. Use the pie chart example provided to guide your answer.
- Calculate the percentage earned by Catering Services (3)
- Calculate the percentage earned by Take-away and Fast-Food outlets (3)
- Calculate the percentage earned by Restaurants and Coffee Shops (3)
- Organize and present your data in a pie chart to show each of the percentages as a slice of the pie chart (5)
- Create a legend for your pie chart (2)
- Supply your pie chart with a heading (2)
Example:
1.3.2
- Determine the Food and Beverage category that showed the largest decline in 2020 when compared to 2019. (2)
- Give ONE reason to motivate your answer to QUESTION 1.3.2 (a). (2)
[22]
TOTAL: 50
| | TOURISM DATA HANDLING TASK GRADE 12 2021 ASSESSMENT INSTRUMENT | |
Name of learner: ________________________________________ Grade: ____
T = Teacher / M = Moderator
| Question 1.1 | INTERPRETATION OF A GRAPH | [8] | |||||
| Criteria | 0 | 1 | 2 | 3 | 4 | T | M |
| 1.1.1 Determine the FOUR months in which overseas tourists spent the highest number of days in South Africa | NO months are correctly determined. | ONE month is correctly determined. | TWO months are correctly determined. | THREE months are correctly determined. | FOUR months are correctly determined. | ||
| Criteria | 0 | 1 | 2 | T | M | ||
| 1.1.2 Provide ONE reason for your answer to QUESTION 1.1.1 | No reason is given, or the reason given is incorrect. | One vague reason is given. | One meaningful reason is given. | ||||
| Criteria | 0 | 1 | 2 | T | M | ||
| 1.1.3 Suggest ONE reason for the trend displayed during the period April to September 2020. | No reason or ONE incorrect reason for the trend is suggested. | ONE vague reason is given. | ONE meaningful reason for the trend is suggested. | ||||
| Question 1.2 | INTERPRETATION OF STATISTICS | [20] | |||||
| Criteria | 0 | 2 | T | M | |||
| 1.2.1 (a) Determine the number of departures of South African residents in 2019. | No answer is given OR the incorrect number of departures is determined. | The correct number of departures is determined. | |||||
| Criteria | 0 | 2 | T | M | |||
| 1.2.1(b) Determine the number of departures of South African residents in 2020. | No answer is given OR the incorrect number of departures is determined. | The correct number of departures is determined. | |||||
| Criteria | 0 | 1 | 2-3 | 4 | T | M | |
| 1.2.1(c) Calculate the percentage decrease in the number of departures of South African residents in 2020 when compared to 2019. Show ALL steps of your calculation. | No answer is given | An attempt is made however the percentage is calculated incorrectly. | The percentage calculation was done correctly but the answer is incorrect. | Percentage for the decrease of 2019 and 2020 departures was calculated correctly. | |||
| Criteria | 0 | 2 | T | M | |||
| 1.2.2 (a) Determine the number of foreign arrivals to South Africa in 2019. | No answer is given OR the incorrect number of arrivals is determined. | The correct number of arrivals is determined. | |||||
| Criteria | 0 | 2 | T | M | |||
| 1.2.2 (b) Determine the number of foreign arrivals to South Africa in 2020. | No answer is given OR the incorrect number of arrivals is determined. | The correct number of arrivals is determined. | |||||
| Criteria | 0 | 1 | 2-3 | 4 | T | M | |
| 1.2.2 (c) Calculate the percentage decrease in the number of foreign arrivals to South Africa in 2020 when compared to 2019. Show ALL steps of your calculation. | No attempt is made. | Percentage is calculated incorrectly. No steps of the calculation are indicated. | Percentage is calculated correctly. Some of the steps of the calculation are indicated. | Percentage is calculated correctly. ALL steps of the calculations are clearly indicated. | |||
| Criteria | 0 | 1 | 2 | 3 | 4 | T | M |
| 1.2.3. Refer to your answers to QUESTIONS 1.2.1 (c) and 1.2.2 (c). Write a paragraph explaining your findings. | No attempt to write a paragraph is made. | An attempt to write a paragraph is made. The explanation is not related to either of the findings. | A paragraph is written. The explanation is related to ONE of the findings. | A paragraph is written. The explanation is related to ONE of the findings and partially related to the SECOND finding. | Findings are fully discussed in a paragraph format. Findings are excellently explained. | ||
| Question 1.3 | TABLE: INCOME OF THE FOOD AND BEVERAGE SECTOR | [22] | ||||
| 1.3.1 | ||||||
| ||||||
| Criteria | 0 | 1 | 2 | 3 | T | M |
| Calculate the percentage earned by Catering Services | No attempt is made. | Percentage is calculated incorrectly. No steps of the calculation are indicated. | Percentage is calculated correctly. Some of the steps of the calculation are indicated. | Percentage is calculated correctly. ALL steps of the calculations are clearly indicated. | ||
| ||||||
| Criteria | 0 | 1 | 2 | 3 | T | M |
| Calculate the percentage earned by Take-away and Fast-Food outlets | No attempt is made. | Percentage is calculated incorrectly. No steps of the calculation are indicated. | Percentage is calculated correctly. Some of the steps of the calculation are indicated. | Percentage is calculated correctly. ALL steps of the calculations are clearly indicated. | ||
| ||||||
| Criteria | 0 | 1 | 2 | 3 | T | M |
| Calculate the percentage earned by Restaurants and Coffee Shops | No attempt is made | Percentage is calculated incorrectly. No steps of the calculation are indicated. | Percentage is calculated correctly. Some of the steps of the calculation are indicated. | Percentage is calculated correctly. ALL steps of the calculations are clearly indicated. | ||
| ||||||
| Criteria | 0 | 1-2 | 3-4 | 5 | T | M |
| Organize and present your data in a pie chart to show each of the percentages as a slice of the pie chart | No attempt is made. | Only one or two slices of the pie chart are presented. Only one or two slices of the pie chart's percentages are presented correctly. No clear distinction can be made between the presented slices of the pie chart. | Three slices of the pie chart are presented. A clear distinction can be made between the presented slices of the pie chart. Only two slices of the pie chart's percentages are presented correctly. | Three slices of the pie chart are presented. A clear distinction can be made between the presented slices of the pie chart. Three slices of the pie chart's percentages are presented correctly. | ||
| ||||||
| Criteria | 0 | 1 | 2 | T | M | |
| Create a legend for your pie chart | No legend is created. | The legend contains only some of the categories OR the categories are not correctly linked to the slices of the pie chart. | The legend contains all three categories. ALL the categories are correctly linked to the slices of the pie chart. | |||
| ||||||
| Criteria | 0 | 1 | 2 | T | M | |
| Supply your pie chart with a heading | No heading is supplied. | An unsuitable heading is supplied. | A suitable heading is supplied. | |||
| 1.3.2 | ||||||
| Criteria | 0 | 1 | 2 | T | M | |
| 1.3.2 (a) Determine the Food and Beverage category that showed the largest decline in 2020 when compared to 2019. | No attempt is made, or the category is incorrectly determined. | An attempt is made however the category is partially correct. | The category is correctly determined. | |||
| Criteria | 0 | 1 | 2 | T | M | |
| 1.3.2 (b) Give ONE reason to motivate your answer to QUESTION 1.3.2 (a). | No attempt is made. | The reason given is vague. | An excellent motivation is provided. | |||
| TOTAL:50 | ||||||