CLIMATE AND WEATHER GRADE 12 NOTES - GEOGRAPHY STUDY GUIDES
Share via Whatsapp Join our WhatsApp Group Join our Telegram Group- Introduction
- Cyclones
- Factors affecting the South African climate
- Local climate (valley and city climate)
This chapter covers secondary (regional) and tertiary (local) circulations or weather patterns. This knowledge will enable you to analyse weather patterns and the microclimate of cities and valleys in the exam.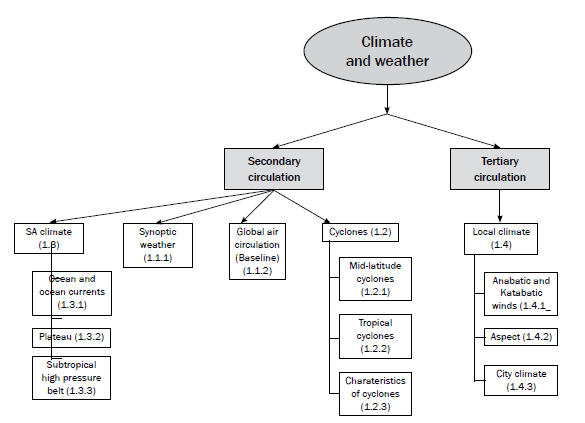 Key concepts
If you know and understand the definitions in this chapter, you will be able to answer most of the questions in the climate and weather (climatology) section of the final exam. Use your mobile notes to learn these concepts well (see page x for instructions on how to make them). Adding pictures to your mobile notes will help you remember the concepts.
| CONCEPT | DEFINITION |
| Anabatic winds | Warm winds that blow up a valley slope during the day. |
| Anticyclone (high pressure) | Forms as a result of sinking air. Air movement is anticlockwise, divergent (outwards), subsiding (sinking) in the southern hemisphere, e.g. South Atlantic High, South Indian High and Kalahari High. |
| Aspect | The direction in which a slope faces. |
| Berg winds | Hot, dry winds that blow from the interior of South Africa to coastal areas. |
| Climate change | Long-term changes to the global climate, resulting in unusual and extreme (stronger) weather conditions. |
| Cyclone (low pressure) | Forms as a result of rising air. Air movement is clockwise, convergent (inwards), rising (convection) in the southern hemisphere, e.g. coastal low, tropical cyclone, mid-latitude cyclone. |
| Heat island | Higher temperatures in urban areas than the surrounding rural area. There are many causes of heat island including pollution. |
| Inversion layer | Zone where sinking cold air meets with the rising warm air. A layer of the atmosphere in which temperature increases with height. |
| Inter-tropical convergence zone (ITCZ) | An area along the equator where the tropical easterlies from both hemispheres meet. |
| Katabatic winds | Cold winds that blow down a valley slope at night. |
| Polar Easterlies | Winds that blow from the pole towards subpolar low pressure belts (90° to 60°). |
| Temperature inversion | Temperature increasing with height. |
| Thermal belt | Zone of warmer temperature above the valley floor. |
| Tropical easterlies/trade winds | Winds that blow from the subtropical high belts towards the equatorial low pressure belt (0° to 30°). |
| Westerlies | Winds that blow from the subtropical high pressure belts to the subpolar low pressure belts (30° to 60°). |
1.1 Introduction
Our focus will be on the South African climate, mid-latitude cyclones, tropical cyclones, sub-tropical anticyclones and local climate (valley and city climate). But first we need to understand synoptic weather charts (maps), and satellite images.
1.1.1 Synoptic weather map interpretation
To better understand weather patterns and weather phenomena you need to be able to interpret the synoptic weather map. A synoptic weather map shows weather conditions and phenomena (temperature, precipitation, wind speed and direction, atmospheric pressure and cloud coverage) over a wide area at a given time based on worldwide observations recorded at the same time (from weather stations, airplanes, weather balloons and satellites).
On a synoptic weather map there are lines called isobars:
- These lines join points of equal pressure (all along one isobar the pressure is the same).
- The pressure is measured in hectopascals (hpa)/millibars (mb).
- The isobars form patterns (shapes formed by many isobars).
Figures 1.1.1A shows a low pressure and high pressure cell
Synoptic weather maps are very often tested in the exam.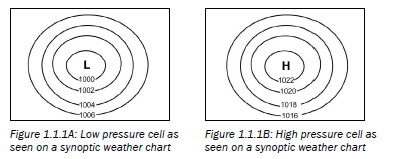
Note that the pressure reading decreases towards the centre of a Low and increases towards the centre of a High.
Figure 1.1.1C on page 4 shows a simple weather station. It describes the weather of a particular place that is found on a synoptic weather map. In the exam, you may be asked to describe the weather of a particular place on the synoptic weather map by referring to the weather station. You will need to comment on the following weather elements:
- Cloud cover
- Wind direction
- Wind speed
- Air temperature
- Dew point temperature
- Precipitation (any form of water falling from the sky, e.g. rain, hail, snow and ice)
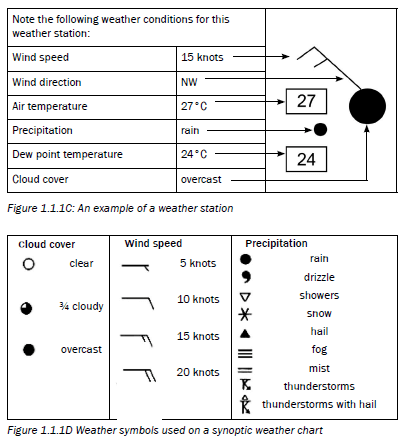
When answering questions based on a synoptic weather chart in the exam, you will be given either a summer synoptic chart (see Figure 1.1.1E) or a winter synoptic chart (see Figure 1.1.1F).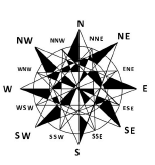
Remember your compass points to determine wind direction.
Make sure you know the weather symbols shown in Figure 1.1.1D (right). They will help you to write this type of question.
Summer synoptic chart
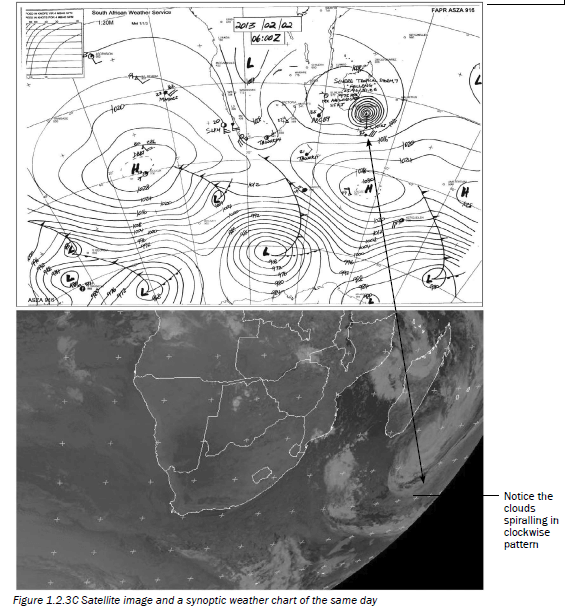
Figure 1.1.1E shows a typical summer synoptic weather chart of South Africa. The features of a summer synoptic chart to note are:
- Tropical cyclone (look for the symbol on the synoptic chart)
- Low pressure over the land (see the low pressure cell in Figure 1.1.1E)
- The date
- South Indian high pressure found south east of South Africa is further south (see the high pressure cell in Figure 1.1.1E)
- Generally high temperatures over the land
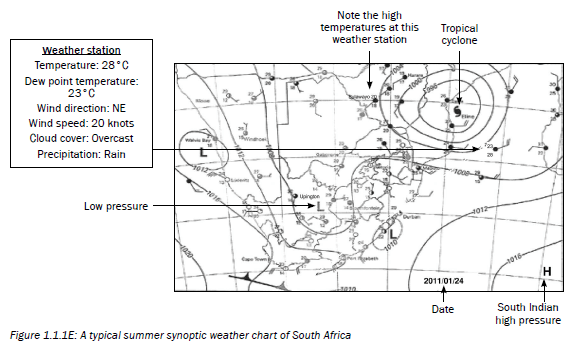
Make sure you know which features to look out for on the chart you are given.
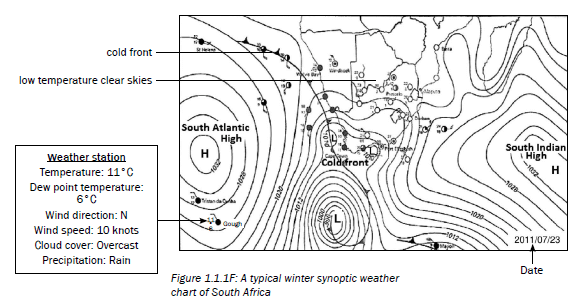
Winter synoptic weather chart
Figure 1.1.1F shows a typical winter synoptic weather chart of South Africa.
The features of a winter synoptic weather chart to note are:
- Cold fronts moving over the land
- Dominant Kalahari high pressure over the land (look for a large high pressure cell over the land)
- The date
- South Indian high pressure and the South Atlantic high pressure are closer to the land and further north
- Generally low temperatures over the land
1.1.2 Global air circulation
These are winds that cover large areas over the Earth’s surface. There are three global wind systems:
- The tropical easterlies
- The westerlies
- The polar easterlies
A force called Coriolis force causes global winds to move to the left in the southern hemisphere and to the right in the northern hemisphere.
The tri-cellular arrangement, the pressure belts and the global winds together form the global air circulation. This is shown in Figure 1.1.2 below.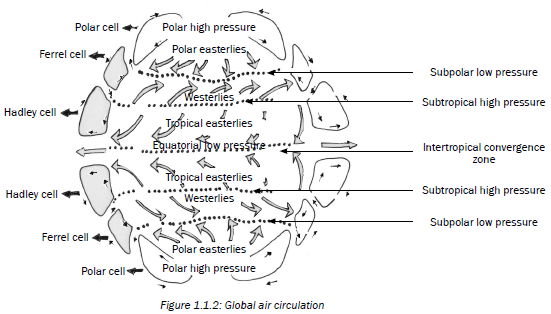 Learn to redraw Figure 1.1.2 and label it from memory.
1.2 Cyclones
1.2.1 Mid-latitude cyclones
In this section, we look at mid-latitude cyclones in more detail. We will focus on the cross-section through a mature mid-latitude cyclone and the weather that occurs as a result of the cold front. This is the most frequently tested section as South Africa is mostly affected by the passage of cold fronts.
Figure 1.2.1A shows a cross-section through a mid-latitude cyclone. You must be able to label and sketch the cross-section from a synoptic view, as shown in Figure 1.2.3A (see page 10, table 1.1).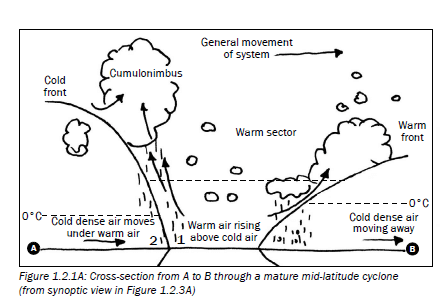
Learn to redraw Figure 1.2.1A and label it. You must be able to describe the weather that occurs with a mid-latitude cyclone.
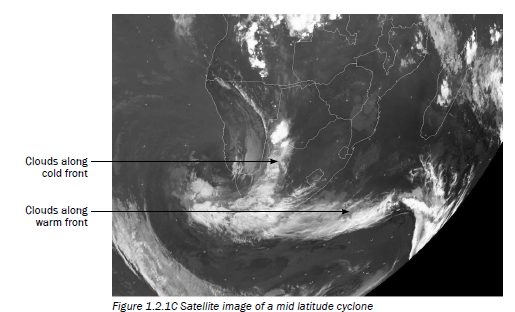
As a mid-latitude cyclone moves towards South Africa, it is the cold front that mostly affects our weather (see Figure 1.2.1C on page 8).
Weather in front of the cold front (see point 1 in Figure 1.2.1A above):
- Cool temperatures
- Very low pressure
- Overcast conditions, cumulonimbus clouds
- Thunderstorms
Weather behind the cold front (see point 2 in Figure 1.2.1A above):
- Cold temperatures
- High pressure
- Partly cloudy conditions, cumulus clouds
- Light rain
Note that as a mid-latitude cyclone moves from west to east, we experience the warm air mass in front of the cold front first, then the air behind the cold front. This can be seen in Figure 1.2.1A (above) as you move over from point 1 to 2.
Figure 1.2.1B (below) shows the weather conditions before and after the cold front.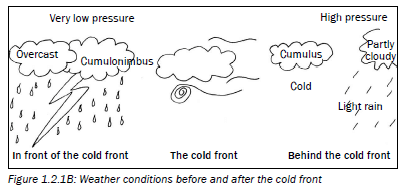
 1.2.2 Tropical cyclones
A tropical cyclone is a type of low pressure system which generally forms in the tropics (between 5°C and 30°C North and South). It is accompanied by thunderstorms and a circulation of winds near the Earth’s surface, which is clockwise in the southern hemisphere and counter-clockwise in the northern hemisphere. Tropical cyclones are also known as hurricanes in America; typhoons in China and Japan; and willywillies in Australia. Tropical cyclones are given names alphabetically within the season in which they occured. For example, ‘Alfred’ will denote that it is the first tropical cyclone to occur in that season.
We will now look at tropical cyclones in more detail by focusing on the cross-section through a mature tropical cyclone.
In order for the tropical cyclone to occur there should be:
- temperature of 27°C and more
- Coriolis force
- enough moisture
- less function
Figure 1.2.2A shows a crosssection through a tropical cyclone. You must be able to label and sketch the cross-section from a synoptic view as shown in Figure 1.2.3A (see page 10, table 1.1).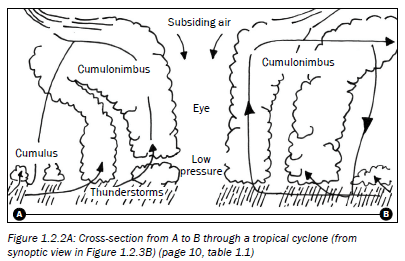
Make sure you are able to draw Figure
1.2.2A and label it correctly.
1.2.3 Characteristics of mid-latitude cyclones and tropical cyclones
1. Multiple-choice questions
2. Short answer questions
For example, see Figures 1.2.2A and 1.2.3B. |
Table 1.1 compares the characteristics of mid-latitude cyclones and tropical cyclones.
| CHARACTERISTICS | ||
| Mid-latitude cyclone | Tropical cyclone | |
| Other names | Frontal depression, temperate cyclone, extra tropical cyclone | Hurricane, typhoon, Willywillies (named alphabetically at the beginning of each season) |
| Formation | 40–60o N and S | around 5o N and S |
| Occurrence | 30–60o N and S | Over tropical oceans 5–30o N and S |
| Movement | West to east (driven/pushed by Westerlies) | East to west (driven/pushed by Easterlies) |
| Season | All year round in both hemispheres; affects South Africa in winter | Mid- to late summer, early autumn |
| Identifying features | Warm front, warm sector, cold front, cold sector | Stormy weather in the vortex; the eye is a calm, intense low pressure area |
| Weather | Weather associated with a cold front: overcast, low temperatures, strong winds, heavy rain | Warm to hot, violent winds; intense thunderstorm activity |
| Areas affected | Western side of continents in mid-latitudes | Eastern side of continents in tropical latitudes |
| Synoptic representation of the cyclones on a weather map | 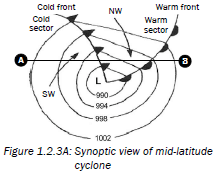 | 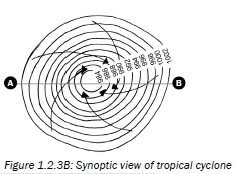 |
You must know the characteristics of each cyclone. In the exam these characteristics are typically asked in one of three ways:
1.3 Factors affecting the South African climate
There are three factors that have the greatest impact on South Africa’s climate:
- South Africa is surrounded by oceans and ocean currents.
- South Africa is mostly found on a plateau.
- South Africa is affected by the subtropical high pressure belt.
These three factors cause the typical weather we experience in each season. Let us look at each factor in more detail.
1.3.1 The impact of the ocean and the ocean currents on South Africa’s climate
Much of South Africa is surrounded by oceans. The oceans affect the temperature at the coast and inland as follows:
- Water heats up slowly and cools down slowly.
- This moderates temperatures along the coastline (i.e. the minimum and maximum temperatures are not very far apart) – also known as maritime.
- This causes temperatures inland to be extreme (i.e. the minimum and maximum temperatures are very far apart) – also known as continental.
For example, in winter the temperature in Johannesburg is a maximum of 25°C and a minimum of 1°C (extreme), whereas in Durban the maximums 24°C and the minimum is 15°C (moderate).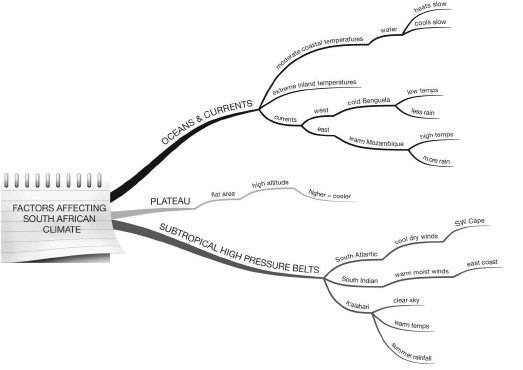 The warm Agulhas current flows along the south coast. However, you do not need to know how it affects the country’s climate.
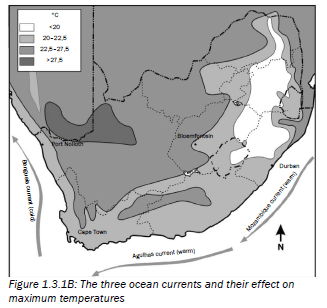
The ocean currents also affect the temperatures and rainfall:
- The currents on our east and west coasts have the greatest impact on South Africa’s climate.
- The warm Mozambique current flows along our east coast.
- The cold Benguela current flows along our west coast.
- The warm Mozambique current causes high temperatures and more rain on the east coast.
- The cold Benguela current causes low temperatures and less rain on our west coast.
Because of the influence of these currents, temperatures are higher on the east coast than on the west coast. Figure 1.3.1A shows the ocean currents that affect South Africa’s climate and the resultant minimum temperatures.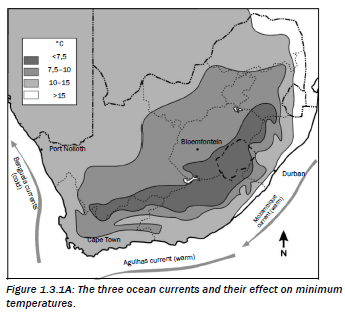
Figure 1.3.1B shows the ocean currents that affect South Africa’s climate and the resultant maximum temperatures.
Figure 1.3.1C shows the seasons in which rainfall is received in South Africa. The black arrow shows how rainfall decreases from east to west across the country mainly due to the Mozambique and Benguela currents.
- The east coast gets rain all year round, so it will have a higher rainfall.
- The west coast is an arid (desert) region so it receives very little rain.
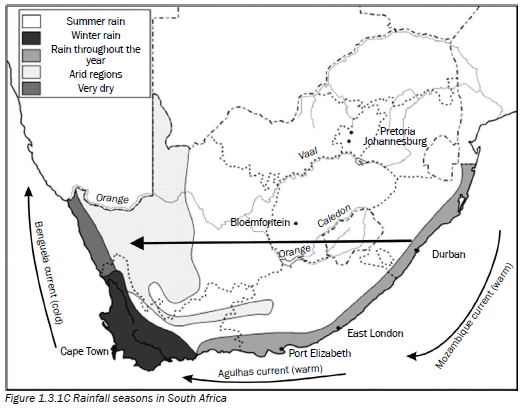
To prepare well for the exam and to understand this topic better, find out the cause of the winter rainfall in the south-western Cape.
1.3.2 The impact of the plateau on South Africa’s climate South Africa is situated mostly on a plateau (a flat area found at a high altitude).
Figure 1.3.2A below is a cross-section of South Africa from west to east showing the relief (landscape) of the country.
The higher you go, the cooler it gets. Therefore, places on the plateau (high altitude) will experience lower temperatures than places at a lower altitude.
Places in the Lowveld (Mpumalanga) have higher temperatures than places on the Highveld (Gauteng and Free State).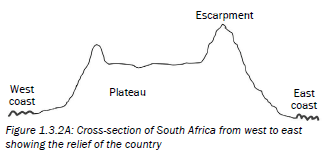
1.3.3 The impact of the subtropical high pressure belt on South Africa’s climate
South Africa is affected by three high pressure cells:
- South Atlantic high pressure (SAHP)
- South Indian high pressure (SIHP)
- Kalahari high pressure (KHP)
To prepare well for the exam and understand this topic better, find out how the Kalahari high pressure causes the plateau to receive summer rainfall only.
Figure 1.3.3A below shows the position of the three high pressure cells in and around South Africa.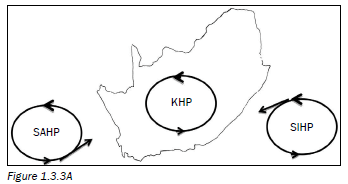
- The South Atlantic high pressure causes cool, dry winds to blow onto the south-western Cape.
- The South Indian high pressure causes warm, moist winds to blow onto the east coast.
- The Kalahari high pressure has the greatest impact on South Africa’s climate:
- It causes generally clear skies and warm temperatures because the air is descending and dry (in winter).
- It results in only summer rainfall occurring on the plateau.
Activity 1
Study the synoptic weather chart in Figure 1.3.3B below and answer the questions that follow.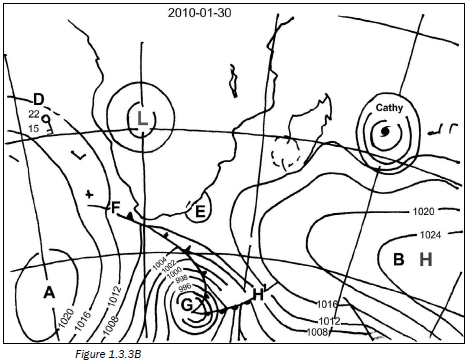
- Name the high pressure cells labelled A and B. (2 × 2 = 4)
- Give TWO pieces of evidence from the map that this is a summer map. (2 × 2 = 4)
- Identify the low pressure cell labelled E. (1 × 2 = 2)
- The letter G indicates a mid-latitude cyclone.
- Name the fronts labelled F and H. (2 × 2 = 4)
- In which direction does this cyclone generally move? (1 × 2 = 2)
- Describe how front F will affect the weather of Cape Town. (3 × 2 = 6)
- Refer to the cyclone named Cathy.
- What type of cyclone is Cathy? (1 × 2 = 2)
- State how many cyclones have occurred for this season, including Cathy. (1 × 2 = 2)
- In which direction does this cyclone move? (1 × 2 = 2)
- List TWO conditions necessary for this cyclone to form. (2 × 2 = 4)
- Refer to the weather station labelled D and describe the weather in terms of: cloud cover, wind speed, wind direction, air temperature, dewpoint temperature. (4 × 2 = 8)
[40]
Answers to activity 1
|
1.4 Local climate (valley and city climate)
Valley climate occurs on a local scale and lasts for a few hours. In this section we will focus on:
- Anabatic and katabatic winds
- Aspect
Anabatic means ‘moving upward’ and katabatic means ‘going downhill’.
1.4.1 Anabatic and katabatic winds
The structure of a valley and the heating and cooling that occurs during a day cause anabatic and katabatic winds to occur. This is shown in Figures 1.4.1A and 1.4.1B.
In the exam, you may be asked to draw, label or describe how anabatic or katabatic winds form in valleys. Learn to redraw and label Figures 1.4.1A and 1.4.1B below.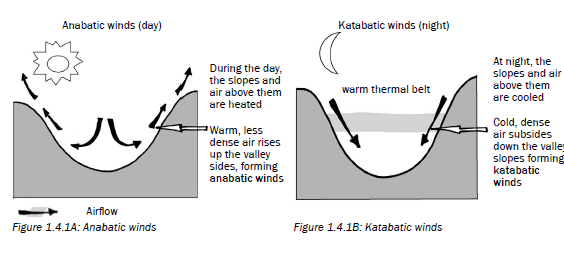 Effect of anabatic winds on settlements
- Anabatic winds take pollution out of the valley.
Effects of katabatic winds on settlements
- Katabatic winds trap pollution in the valley.
- Katabatic winds bring cold temperatures to the valley.
Katabatic winds lead to the development of the thermal belt (zone of warmer temperature above the valley floor) and a frost pocket (an area of very cold temperatures at the bottom of a valley where frost occurs) in a valley at night. This is shown in Figure 1.4.1C.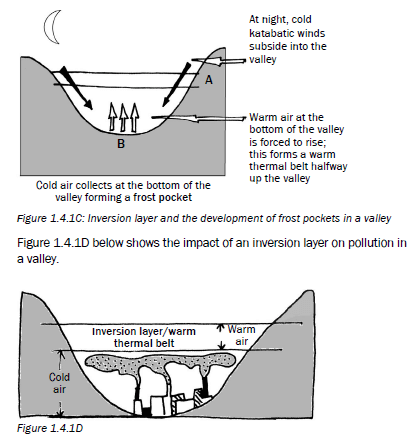
Effects of warm thermal belt on settlement and farming
- People will build their houses halfway up the slope of a valley to be in the warmer thermal belt (point A on Figure 1.4.1C).
- Crops which need warm, frost-free conditions will be planted in the thermal belt, for example sugar cane (point A on Figure 1.4.1C).
Effects of frost pockets on settlement and farming
- Crops which can withstand cold conditions (such as frost) can be planted at the bottom of the valley, for example potatoes (point B on Figure 1.4.1C).
- Pollution is trapped in the cold air below the temperature inversion at night, as shown in Figure 1.4.1D.
1.4.2 Aspect
Aspect refers to the direction in which a slope faces. This determines whether the Sun’s rays will hit the side of the valley directly or indirectly (obliquely). We will focus on how aspect influences the temperatures of north- and south-facing slopes in the southern hemisphere.
In the exam, you may be asked to draw, label or describe how the thermal belt and a frost pocket form in valleys. Learn to redraw and label Figure 1.4.1C.
Let us look at how the Sun’s rays affect slope temperatures in the southern hemisphere:
- North-facing slopes receive the direct rays of the Sun, making them warmer.
- South-facing slopes receive the indirect rays of the Sun, making them cooler.
Figure 1.4.2A shows how aspect influences the temperatures of north- and south-facing slopes in the southern hemisphere.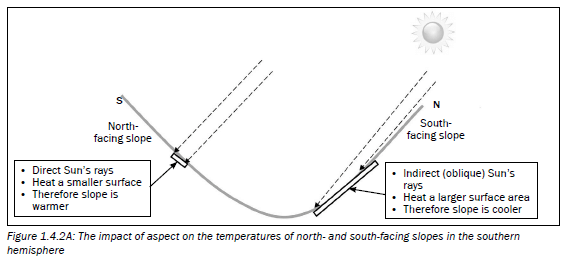 Activity 2
Figure 1.4.2B (left) illustrates valley climates. Study the diagram and answer the questions that follow.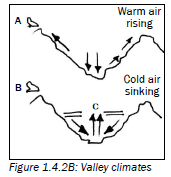
- Name the valley winds depicted in A and B. (2 × 2 = 4)
- State ONE advantage of the wind labelled A. (1 × 2 = 2)
- Name the layer labelled C. (1 × 2 = 2)
- Explain how the wind labelled B influences:
- Farming in the valley (2 × 2 = 4)
- Industry in the valley (2 × 2 = 4)
[16]
Answers to activity 2
|
In the exam, you may be asked to draw, label or describe how aspect affects the temperature on a north- or south-facing slope in the southern hemisphere.
Answers to activity 2 continued
1.4.3 City climates
Urban areas (cities) experience a different climate compared to the surrounding rural areas. This results in the formation of a heat island over the city. In this section, we will focus on the causes of a heat island. An urban heat island is when the city has warmer temperatures than the surrounding rural areas.
In the exam, you may be asked how the temperatures change as you move towards the centre of the city. Figure 1.4.3A shows how the temperatures increase the closer you get to the city centre (also called the Central Business District, or CBD). Note also the lower temperatures over the park.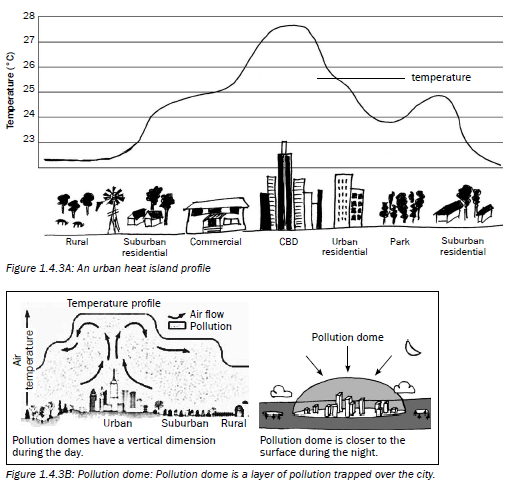 In the exam, you may be asked to say what causes a city to be warmer.
Table 1.2 below lists the factors that cause higher temperatures in the city.
| Factors that cause heat island | Explanation |
| Artificial (human-made) surfaces | Surfaces like tar absorb more heat. |
| Surface area (the sides of the buildings add to the surface area) | With a greater area, more heat is absorbed. |
| Pollution | More factories and cars release more pollution, which traps the heat. |
| Artificial heat sources (not from the sun, human-made sources) | Factories, cars and air conditioners release heat into the air. |
Table 1.2: Factors that cause a heat island
Sustainable ways to reduce the urban heat island effects
- Promote greenbelts (plan and have more parks or recreational areas with trees and plants).
- Plant more trees in the city.
- Increase vegetation cycles by planting rooftop gardens.
- The new buildings should not be built with material like glass or any reflecting material.
- The height of the buildings should have a limit.
- Have laws that force the factories to reduce the amount of pollution they produce.
- Improve and encourage people to use public transport.
- Promote lift clubs to work or to school.