MATHEMATICS LITERACY PAPER 2 GRADE 12 QUESTIONS - NSC PAST PAPERS AND MEMOS JUNE 2022
Share via Whatsapp Join our WhatsApp Group Join our Telegram GroupNATIONAL SENIOR CERTIFICATE
GRADE 12
JUNE 2022
MATHEMATICAL LITERACY
MARKS: 100
INSTRUCTIONS AND INFORMATION
- This question paper consists of FOUR questions. Answer ALL the questions.
- Use the ANNEXURES in the ADDENDUM for the following questions:
ANNEXURE A for QUESTION 1.1
ANNEXURE B for QUESTION 2.2 - Number the questions correctly according to the numbering system used in this question paper.
- Start EACH question on a NEW page.
- You may use an approved calculator (non-programmable and non-graphical), unless stated otherwise.
- Show ALL calculations clearly.
- Round off ALL final answers appropriately accordingly to the given context, unless stated otherwise.
- Indicate units of measurement, where applicable.
- Maps and diagrams are NOT drawn to scale, unless stated otherwise.
- Write neatly and legibly.
QUESTION 1
1.1
| ANNEXURE A represents the Kruger National Park with all camps and gates. |
1.1.1 Name the country next to the Kruger National Park as shown on the addendum. (2)
1.1.2 How many tented camps are shown on the map? (2)
1.1.3 How many gates are on the map? (2)
1.1.4 What type of camp is Lower Sabie? (2)
1.2 Below is a table tennis bat with dimensions. Use the information given to answer the questions that follow.
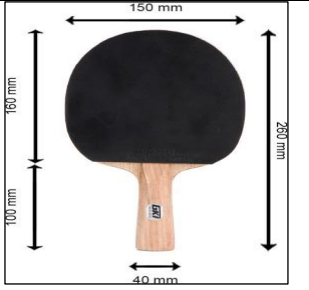
1.2.1 Write the height of the bat in cm. (2)
1.2.2 What is the difference in metres between the width of the handle of the bat, and the width of the bat? (3)
1.2.3 Write the height of the handle of the bat to the width of the bat as a simplified ratio. (3)
1.3
| A caterer has prepared light snacks for a table tennis match and players are allowed to choose and the choices are as follows: a muffin or a sandwich with a Coke, a juice or bottled water. |
1.3.1 There are 14 couples, and she needs to prepare 3 more packs of light snacks. How many light snacks will she have to prepare? (2)
1.3.2 Write down the number of combination options they can choose from. (2)
[20]
QUESTION 2
2.1 The distance map below is showing distances (in km) between some towns in South Africa. Answer the questions based on the distance map below.
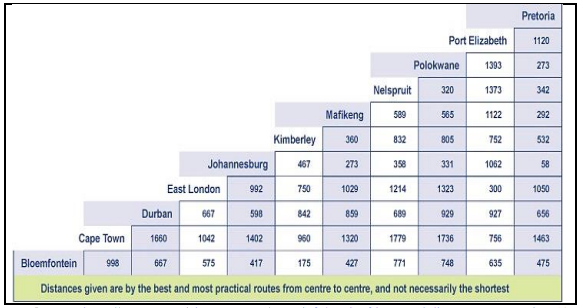
[Source: https://www.aroundaboutcars.com/more-info/south-african-road-distances. Accessed on 19 October 2021.]
2.1.1 What is the distance in metres between East London and Mafikeng? (3)
2.1.2 A family travels from Cape Town to Johannesburg and then proceeds to Bloemfontein. The family claims that the total distance travelled is 40 km more than the distance between Cape Town and Nelspruit. With calculations prove whether their claim is valid or not. (6)
2.1.3 Calculate the time in hours and minutes they will take to travel from Polokwane to Port Elizabeth if they are travelling at an average speed of 105 km/hr and have two breaks of 1 hour 15 minutes in total.
You may use the formula: Distance = Speed x Time (6)
2.2
| ANNEXURE B represents the Comrades Marathon route which is a distance of 90 km between Durban and Pietermaritzburg. |
2.2.1 What type of scale is shown on the map? (2)
2.2.2 Use the given scale to calculate the distance in metres between Hillcrest and Pinetown. Round off your final answer to the nearest metres. (4)
2.2.3 Give the general direction from Camperdown to Westville. (2)
2.2.4 The map shows that 870 m = 2 850 feet. Determine, rounded off to two decimals, that the conversion factor is in the form, 1 foot = … cm. (4)
2.2.5 David Vazi travelled by car to the Comrades Marathon during 2019. His car consumed fuel at a rate of 10 km per litre. He decided to travel by aeroplane from Durban to Pietermaritzburg. If the fuel price is R16, 98 per litre, calculate the cost of a return journey between Polokwane and Durban.
NOTE: Refer to the distance map in QUESTION 2.1. (5)
[32]
QUESTION 3
3.1 Table tennis is a very popular sport at the Olympic Games. Below is a diagram of the dimensions of a table tennis table.
NOTE: The net has an overhang of 15,25 cm on both sides.
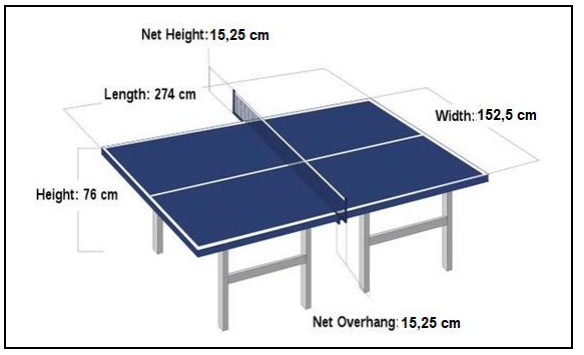
3.1.1 Determine the length of the net in cm. (3)
3.1.2 Calculate the difference between the length and the width of the table in mm. (3)
3.1.3 Table tennis players as all sports players are serious about their fitness levels. A game started at 10:08 and lasted for 1 hour and 58 minutes. At what time did the game end? (3)
3.1.4 One of the players argues that the height of the table from the bottom (ground) up to the top of the net is 60 cm less than the width of the table. Prove with calculations whether his argument is valid or not valid. (4)
3.2
| A Mathematics Literacy teacher is making teaching aids for a lesson topic on measurement in her class. She draws the shapes, paints them, and sticks them onto the classroom walls. The shape below with dimensions is one of her teaching aids. |
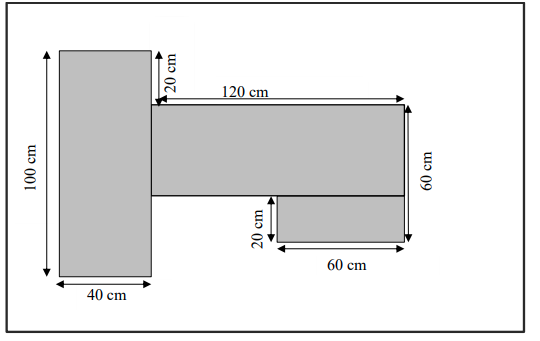
3.2.1 A learner uses string to measure the perimeter of the shaded figure. What is the length of the string used? (3)
3.2.2 Calculate the total area of the shape in m2.
You may use the formula: Area of a rectangle is = Length x Width (5)
3.2.3 She paints this shape with two coats of paint and has prepared two shapes for her class. If one litre of paint covers 6,2 m2
, determine (rounded to TWO decimal places) the number of litres of paint required to paint two shapes. (5)
3.2.4 The salesman at the hardware store stated that one 500 mℓ can of paint is not sufficient to paint the two shapes completely. Verify, with calculations, whether his statement is valid. (3)
[29]
QUESTION 4
Below is a seating plan for a theatre.
4.1
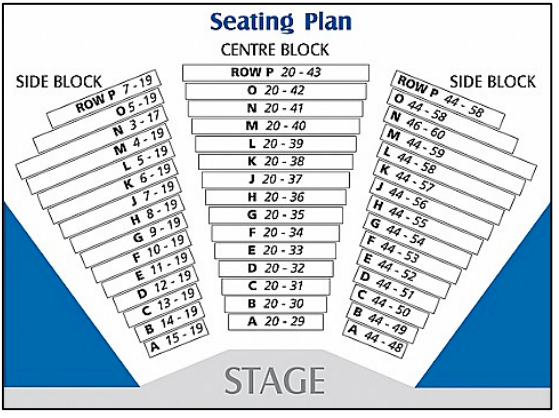
4.1.1 What is the probability of choosing seat H from the seats in the centre block? Give your answer as a percentage. (3)
4.1.2 What is the seat number for a person seating on the right side of the stage, fourth row from the stage, first seat from the passage between the centre block and the side block? (2)
4.1.3 What is the total number of seats in rows D, E, and H? (4)
4.2
| BMI (Body mass index) is a number calculated from a person’s weight and height. The higher the BMI the more a person is at risk of having health problems. For calculating BMI you can use the formula: (Height in m)2 x BMI = Weight in kg |
Below is a table showing BMI and health risks related to it:
| BMI | CLASSIFICATION | HEALTH RISK |
| <18,5 | Underweight | Minimal |
| 18,5‒24,9 | Normal | Minimal |
| 25‒29,9 | Overweight | Increased |
| 30‒34,9 | Obese | High |
| 35–39,9 | Severely obese | Very High |
| >40 | Morbidly obese | Extremely high |
4.2.1 What is the maximum BMI for an overweight person? (2)
4.2.2 Mary has a weight of 95 kg and a height of 1,7 m. She states that her health risk is minimal. Use a calculation to verify if her statement is valid. (4)
4.2.3 What can Mary do to improve her health risk? Mention TWO lifestyle changes. (4)
[19]
TOTAL: 10