GEOGRAPHY PAPER 2 GRADE 12 QUESTIONS - NSC EXAMS PAST PAPERS AND MEMOS NOVEMBER 2018
Share via Whatsapp Join our WhatsApp Group Join our Telegram GroupGEOGRAPHY
PAPER 2
GRADE 12
NSC EXAMS
PAST PAPERS AND MEMOS NOVEMBER 2018
RESOURCE MATERIAL
- An extract from topographic map 2930CB PIETERMARITZBURG.
- Orthophoto map 2930 CB 8 PIETERMARITZBURG.
- NOTE: The resource material must be collected by schools for their own use.
INSTRUCTIONS AND INFORMATION
- Write your EXAMINATION NUMBER and CENTRE NUMBER in the spaces on the cover page.
- Answer ALL the questions in the spaces provided in this question paper.
- You are provided with a 1 : 50 000 topographic map (2930CB PIETERMARITZBURG) and an orthophoto map (2930 CB 8 PIETERMARITZ BURG) of a part of the mapped area.
- You must hand the topographic map and the orthophoto map to the invigilator at the end of this examination session.
- You may use the blank page at the end of this question paper for all rough work and calculations. Do NOT detach this page from the question paper.
- Show ALL calculations and use the formulae provided, where applicable. Marks will be allocated for these.
- Indicate the unit of measurement in the final answer of calculations, e.g. 10 km; 2,1 cm.
- You may use a non-programmable calculator.
- You may use a magnifying glass.
- The area demarcated in RED on the topographic map represents the area covered by the orthophoto map.
- The following English terms and their Afrikaans translations are shown on the topographic map:
ENGLISH- Aerodrome
- Diggings
- Canal
- Firebreak
- Golf Course
- Hiking Trail
- Hospital
- River
- Sewerage Works
- Waterworks
GENERAL INFORMATION ON PIETERMARITZBURG Pietermaritzburg (umGungundlovu) is the capital city of KwaZulu-Natal. This second largest city in the province was founded in 1838. It is a regionally important industrial hub, well-known for processing aluminium, timber and dairy products. It has an estimated population of around 500 000 (including neighbouring townships). Pietermaritzburg is situated along the N3 national road, the main route between the Pretoria-Witwatersrand-Vereeniging conurbation and the harbour city of Durban, some 90 kilometres from Pietermaritzburg. The Oribi airport is situated just outside Pietermaritzburg and has a regular scheduled service to the OR Tambo International Airport in Johannesburg.
|
QUESTIONS
QUESTION 1: MULTIPLE-CHOICE QUESTIONS
The questions below are based on the 1 : 50 000 topographic map (2930CB PIETERMARITZBURG) as well as the orthophoto map of a part of the mapped area. Various options are provided as possible answers to the following questions. Choose the answer and write only the letter (A–D) in the block next to each question.
1.1 Pietermaritzburg is the capital city of …
- Mpumalanga.
- KwaZulu-Natal.
- Free State.
- Limpopo.
1.2 The harbour closest to Pietermaritzburg is …
- Richards Bay.
- Port Elizabeth.
- Durban.
- Cape Town.
1.3 If you travel along the N3 in a north-westerly direction you will reach the town/city of …
- New Hanover.
- Donnybrook.
- Merrivale.
- Harrismith.
1.4 The true bearing of spot height 1031 (K) in block B6 from trigonometrical station 263 (J) in block D7 on the topographic map is …
- 341°
- 161°
- 140°
- 19°
1.5 The economic activity at U in block A12 is a ... activity.
- primary
- secondary
- tertiary
- quaternary
1.6 The land-use zone at 1 on the orthophoto map is the …
- CBD.
- transition zone.
- green belt.
- rural-urban fringe.
1.7 The human-made feature at 2 on the orthophoto map is a …
- veterinary clinic.
- townhouse complex.
- shopping centre.
- office park.
1.8 The slope at line 3 on the orthophoto map is …
- concave.
- convex.
- stepped.
- uniform.
1.9 The main human-made factor that influenced the site of the farmstead at L in block B9 on the topographic map is …
- the other road.
- a market.
- a reservoir.
- flat land.
1.10 The stream/drainage pattern that dominates area M in block B10 and block B11 on the topographic map is a … pattern.
- centripetal.
- radial.
- rectangular.
- trellis.
1.11 The dominant street pattern in block G2 on the topographic map is …
- radial.
- unplanned irregular.
- grid iron.
- planned irregular.
1.12 The feature controlling the amount of water flowing through the canal in block H8 on the topographic map:
- Bridge
- Buildings
- Weir
- Slope
1.13 Swartkop in block F1 on the topographic map is a …
- butte.
- mesa.
- pointed butte.
- conical hill.
1.14 The general direction of flow of the river in the valley represented by the curved line 4 on the orthophoto map:
- North
- West
- East
- South
1.15 The distance between T in block A12 and New Hanover on the topographic map is … kilometres.
- 0,2
- 22
- 20,2
- 2 (15 x 1) [15]
QUESTION 2: MAP CALCULATIONS AND TECHNIQUES
2.1 A tourist visiting Town Hill in Pietermaritzburg requires specific information regarding its location.
2.1.1 State the topographic map index/code of Pietermaritzburg. (1 x 1) (1)
2.1.2 Determine the grid reference/co-ordinates of Town Hill at point N in block F7 on the topographic map. (2 x 1) (2)
2.1.3 The tourist wants to hike the Voortrekker Wagon Hiking Trail in block F6 using a compass. Calculate the magnetic declination for 2018. Show ALL calculations. Marks will be awarded for calculations. Clearly indicate the unit of measurement in your final answer.
Difference in years: __________________________________________
Mean annual change: ________________________________________
Total change: _______________________________________________
Magnetic declination for 2018: __________________________________ (5 x 1) (5)
2.2 Refer to the Voortrekker Wagon Hiking Trail in block F6 on the topographic map.
2.2.1 State the orthophoto map index/code that a tourist will use when hiking the Voortrekker Wagon Hiking Trail. (1 x 1) (1)
2.2.2 Calculate the average gradient between contour line O (height 820 m) and the trigonometrical station at P on the topographic map. Show ALL calculations. Marks will be awarded for calculations. (5 x 1) (5)
- Formula: Average gradient = vertical interval (VI)
horizontal equivalent (HE)
2.2.3 Describe the curved route of the Voortrekker Wagon Hiking Trail from its start at O to the trigonometrical station at World's View. (2 x 1) (2)
2.3 Refer to benchmark 1060.9 at Q in block D4 and spot height 1106 at R in block C6 on the topographic map. The cross-sections below represent the line between Q and R. 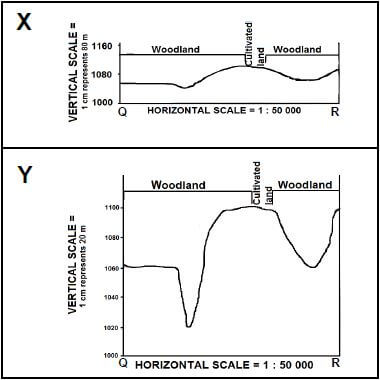
2.3.1 Match cross-sections X and Y with the vertical exaggerations below.
- 25 times: __________________________________________________
- 6,25 times: _________________________________________________ (2 x 1) (2)
2.3.2 Explain how the vertical exaggeration of cross-sections would make interpretation of the landscape easier. (2 x 1) (2) [20]
QUESTION 3: APPLICATION AND INTERPRETATION
3.1 The bottom of the valley at area M on the topographic map experiences frost in the early hours of the morning during winter.
3.1.1 Name the local/tertiary wind that is responsible for the formation of frost. (1 x 1) (1)
3.1.2 Explain how the wind named in QUESTION 3.1.1 causes frost. (2 x 2) (4)
3.2 Refer to slope 5 (low-income residential area) and slope 6 (high-income residential area) on the orthophoto map.
3.2.1 Explain how aspect of slope influenced the site of the high-income residential area at 6. (1 x 2) (2)
3.2.2 Give ONE reason, evident on the orthophoto map, that influenced the location of the low-income residential area at slope 5. (1 x 2) (2)
3.2.3 Suggest how natural vegetation could have influenced the land values of residential areas 5 or 6. (1 x 2) (2)
3.3 Refer to Mabane River and the Gordon Falls in block H2 on the topographic map. Directly upstream of the Gordon Falls the river meanders and directly downstream of Gordon Falls, the river follows a straight path. Explain the reasons for the difference in the stream channel patterns of the Mabane River, as stated above. (2 x 2) (4)
3.4 Is the shopping mall at 7 on the orthophoto map a neighbourhood shopping centre or a regional shopping centre? Give a reason for your answer.
Answer: _________________________________________________________ Reason: _________________________________________________________ (1 + 2) (3)
3.5 Are the industries at Willowton at 8 on the orthophoto map market-orientated or raw material-orientated? Give a reason for your answer.
Answer: _________________________________________________________ Reason: _________________________________________________________ (1 + 2) (3)
3.6 The quarry at S in block D4 on the topographic map is situated next to the residential area of Leonard. Suggest ONE social justice and ONE social injustice that the people of Leonard could experience due to the quarry.
Social justice: _____________________________________________________
Social injustice: ___________________________________________________ (2 x 2) (4) [25]
QUESTION 4: GEOGRAPHICAL INFORMATION SYSTEMS (GIS)
4.1 Refer to block D8 on the topographic map.
4.1.1 Name the type of vector data used in block D8 to indicate the secondary road. (1 x 1) (1)
4.1.2 Explain the relevance of using vector data on the topographic map. (1 x 2) (2)
4.2 Refer to the topographic map and orthophoto map.
4.2.1 Is scale an example of attribute or spatial data? (1 x 1) (1)
4.2.2 Explain the relevance of scale when facing a geographical query/problem, e.g. a possible veld fire in block D8 on the topographic map. (1 x 2) (2)
4.2.3 How can the scale of the topographic map and orthophoto map be manipulated in order to make data integration of these two maps easier? (1 x 2) (2)
4.3 Refer to the topographic map and orthophoto map. The statistics below refer to selected suburbs in Pietermaritzburg and the percentage (%) increase in crime levels from 2015 to 2016.
PERCENTAGE (%) INCREASE IN CRIME LEVELS | |||
TYPE OF CRIME | SUBURBS | ||
Townhill (F7) | Mountain Rise (F1) | Plessislaer (I6) | |
Housebreaking | 18,6% | 11,3% | 23,4% |
Car hijacking | 100% | 177,8% | 36,4% |
[Adapted from SAPS crime statistics 2015–16 by Theuns Kruger, Graphic 24]
4.3.1 Name ONE way in which the data above could have been collected. (1 x 1) (1)
4.3.2 Is the information in the table above primary data or secondary data? (1 x 1) (1)
4.3.3 Which type of crime has shown the highest percentage increase in these suburbs? (1 x 1) (1)
4.3.4 Explain why it is important for the well-being of the community of Pietermaritzburg to analyse these statistics. (2 x 2) (4) [15]
TOTAL: 75