PROBABILITY - MATHEMATICAL LITERACY QUESTIONS AND ANSWERS GRADE 12
Share via Whatsapp Join our WhatsApp Group Join our Telegram GroupActivity 1: Using a tree diagram
Sandwiches will be prepared for morning tea. The sandwiches are made from an equal number of white (W), brown (B) and whole-wheat (H) loaves of bread. The fillings used for the sandwiches are egg (E) or fish (F), with (M) or without (N) mayonnaise.
An incomplete tree diagram which could be used to work out the different combinations of sandwiches that could be made, is given below.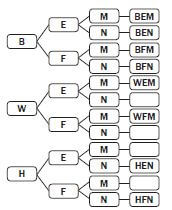
- Explain what the outcome BEM represents on the tree diagram. (1)
- Complete the tree (4)
- Use the tree diagram to write down the probability in simplified form that a sandwich selected at random would:
- be a whole-wheat fish sandwich without (2)
- not be a white bread (2) [9]
Solution
- BEM means brown bread with egg and mayonnaise. ✓ (1)
- The following should be found on the tree diagram:
(a) WEN ✓
(b) WFN ✓
(c) HEM ✓
(d) HFM ✓ (4) - (a) 1/12 OR 0,08 OR 8,33% ✓✓ (2)
(b) 8/12
= 2/3 OR 0,67 OR 66,67% ✓✓ (3)
Activity 2: Using a two-way table
You are putting together a gift pack for toddlers at a day-care centre. There are four possible toys, and a green, red or yellow box to pack them in. The toys are:
- coloured clay
- colouring-in book and crayons
- mini chalkboard and chalk
- pop-up story
- Look at this two-way table which shows the different gift packs you have made
Green
Red
Yellow
A. coloured clay
10
15
5
B. colouring book and crayons
7
20
3
C. mini chalkboard and chalk
12
25
8
D. pop-up story book
9
19
5
- How many packs are there altogether? (6)
- Which pack do you have the least of? (1)
- Which pack do you have the most of? (1)
- The packs are taken out of a bag randomly and given to each Write your answers as common fractions.
- What are the chances of a child getting any green pack? (2)
- What are the chances of a child getting any yellow pack? (2)
- What are the chances of a child getting a red box with a mini- chalkboard? (1)
- What are the chances of a child getting a green box with coloured clay? (2) [15]
Solutions
- You can complete the table like this to find out:
Green
Red
Yellow
A. coloured clay
10
15
5
30
B. colouring book and crayons
7
20
3
30
C. mini chalkboard and chalk
12
25
8
45
D. pop-up story book
9
19
5
33
Total
38
79
21
138
- There are 138 packs in total. ✓
- The yellow boxes with colouring books and ✓
- The red boxes with the mini-chalkboard. ✓
-
- Use the totals from your table above. There are 38 green packs, so the probability is 38/138 = 19/69. ✓✓
There are 21 yellow packs, so the chances are 21/138 = 7/48 . ✓✓
- 25/138
- 10/138 = 5/69
Activity 3: False positives and false negatives
When an athlete takes a drug test, two samples are taken. If the first sample (A) tests positive for drugs, but the athlete believes the test is giving a false positive, they can choose whether to have the second sample (B) screened as well.
Read the extracts from newspaper articles and then answer the questions that follow.
- Extract 1:
Comrades winner fails B-sample drug test
13-JUL-2012 | SAPA | 52 Comrades Marathon winner Ludwick Mamabolo is in danger of losing his title after his B-sample tested positive for methylhexaneamine, the SA Institute for Drug Free Sport (Saids) says.
Mamabolo would face a hearing on a doping charge, according to Saids
Mamabolo’s A-sample tested positive for the banned stimulant after he won the annual 89 km ultra-marathon in Durban last month. - Extract 2:
Comrades winner relieved
2013-05-01 12:20 m.news24.com
Johannesburg - Comrades Marathon champion Ludwick Mamabolo says he is relieved after being cleared of doping charges, more than 10 months after winning the annual ultra-marathon in KwaZulu-Natal.
‘I am delighted that I now have my good name and livelihood back,’ Mamabolo said on Wednesday. I rely on running to support my family.’
Mamabolo tested positive for methylhexaneamine last season, shortly after he became the first South African in seven years to win the Comrades Marathon. His B-sample confirmed the presence of the banned stimulant.
Werksmans Attorneys, which handled Mamabolo’s case, said as many as 15 irregularities were found in the testing process, so Mamabola was found not guilty.
‘We are certain this is the right result for him and for sport,’ said Werksmans Attorneys. - Extract 3:
Marathon Association in bid to improve testing procedures
Wednesday 29 May 2013 14:52, SABC
The Comrades Marathon Association has improved its drug testing procedures to ensure accurate testing for this year’s race.
This comes after last year’s winner, Ludwick Mamabolo, had tested positive for illegal drugs but was later found not guilty after a panel of experts found that the testing process was not up to scratch.
Related Items
- If the drug test has a 95% accuracy, what is the probability that there is a false positive? (1)
- Imagine that the test has a 95% If the first test gives a false positive, what do you think are the chances that the second test (B sample) is also wrong? Choose from:
- certain
- unlikely
- very unlikely (3)
Explain your answer in full.
- Can we be 100% certain that Mamabola did not take a stimulant? (1) [5]
Solutions
- The probability of the test being wrong is 5% or 0,05. ✓
- The answer is (c) very unlikely ✓. The test is unlikely to get an incorrect result once, ✓ so it is much less likely that it would be wrong twice. ✓ (3)
- We cannot be absolutely certain, as there does exist a very small ✓ possibility that the second test is also incorrect (a false negative). (1) [5]
Activity 4: Mixed questions about probability
1. Read the news article extract carefully and answer the questions that follow: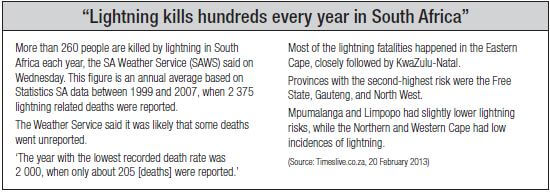
- Where did the SA Weather Service obtain the data for their report that more than 260 people are killed by lightning each year? (1)
- Explain how SAWS obtained the figure of 260 for the number of deaths per year. Show the calculation. (3)
- What kind of statistic is SAWS using when it reports this number? (1)
- SAWS says that it is likely that the number of deaths due to lightning is under-reported. Calculate what the mean would be if the actual number of deaths from 1999 to 2007 was 3 000. (2)
- Were the deaths equally spread out among the nine provinces? Explain. (3)
- Which information did SAWS use in order to arrange the provinces in order of risk? (2)
- Consider these two scenarios of lightning related deaths:
- Scenario A: 100 deaths in one year in a province with a population of 10 000 000
- Scenario B: 20 deaths in one year in a province with a population of 1 000 000
Which of the scenarios indicates a higher probability of death due to lightning? Show your working. (5)
- Some relevant information is not given in this report. Explain. (4) [21]
Solutions
- The data was obtained from Statistics South Africa. ✓
- They took the total number of deaths for all the years, which was 2 375, ✓ and divided it by the number of years between 1999 and 2007.
2 375 ÷ 9 = 263,8 deaths. ✓✓ (3) - The mean. ✓ (1)
- mean = 3 000 ÷ 9 = 333,33 ✓✓ (2)
- No, some provinces have a higher risk than others. ✓ The risk is highest in the Eastern Cape and KwaZulu-Natal. ✓✓ (3)
- The article states ‘Most of the lightning fatalities happened in the Eastern Cape’. This indicates that they used the number of lightning fatalities per province to indicate the risk. ✓✓ (2)
- Scenario A: Probability = 100 ÷ 10 000 000 ✓ = 0,00001 or 1/100000
Scenario B: Probability = 20 ÷ 1 000 000 ✓ = 2/100000 = 1/50000
Scenario B has a much higher risk. ✓ (5) - The report does not state whether the risk numbers ✓ per province were adjusted for the population of the province. ✓ It simply states that the ‘most fatalities’ ✓ occurred in the Eastern Cape. This is also a province with one of the highest populations. ✓ (4) [21]
Activity 5: Mixed questions about probability
Look at the lightning risk map below and read the extract that follows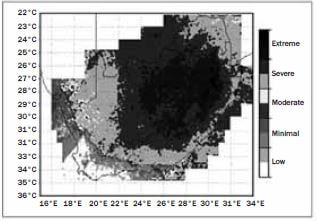
Before 2006, the SAWS (South African Weather Service) was unable to measure lightning activity over South Africa. This limited the SAWS in both its service delivery and public good. This inability changed with the installation of a lightning detection network (SALDN), which enabled the SAWS to explore lightning activity for the first time. These data provide South Africa with the first lightning climatology, based on data for more than a year, measured by the new state-of- the-art SALDN.
Analysis of the maps shows that the highest concentrations of lightning are found over the central to northern interior of the country, with extreme risk areas along the northern escarpment extending from the northern parts of KwaZulu-Natal into the Mpumalanga Lowveld. Almost the entire country is at severe risk from lightning in general. Only towards the west of the country does the concentration of lightning, as well as the lightning risk, decrease.
(Adapted from: http://www.scielo.org.za)
- Compare the sources and types of data in question 1 and the article above. (2)
- Give two reasons why the data in this extract indicates different risks than the article in question 1. (8)
- Which of the articles gives the best estimate of the risks?
Explain your opinion. (2) [12]
Solutions
- Article 1: The data was the number of reported lightning related deaths over nine years, and the source of the data was Statistics South Africa. ✓
Article 2: The data was the lightning density over the country. The source was the SA lightning detection network, which measured the lightning. ✓ (2) - The data set in the second article is the measured lightning density figures, ✓ using the new The risks are measured according to the lightning density, ✓rather than reported deaths. This is apparently a scientific and more accurate method. ✓
The data in the first article was measured up to 2007. The second article uses more up-to-date data. ✓
The risk of lightning-related death is not best given by the number of deaths per province, ✓ because this depends on the number of people in the area, ✓as well as the fact that not all of the data had been reported accurately. ✓
Also note that the first article did not explain whether population figures had been taken into account. ✓ (8) - You need to support your opinion with facts in this question✓The lightning detection network has only been active since 2006. ✓ (2) [12]