PROBABILITY GRADE 12 NOTES - MATHEMATICAL LITERACY STUDY GUIDE
Share via Whatsapp Join our WhatsApp Group Join our Telegram Group- The probability scale
- Games of chance
- Using tree diagrams
- Activity 1: Using a tree diagram
- Using a two-way table to show combined outcomes
- Activity 2: Using a two-way table
- Using predictions in various situations
- False positives and false negatives
- Activity 3: False positives and false negatives
- Activity 4: Mixed questions about probability
- Activity 5: Mixed questions about probability
Probability
Many things in life can’t be predicted with certainty.
The best we can say is how likely they are to happen, using the idea of probability.
Probability helps us to interpret information in many real-life situations, such as:
- drug and pregnancy tests
- risk analysis in business
- working out all the possible combinations of items
- games of chance, such as cards, dice and gambling
- weather forecasts
- risks of veld fires and lightning
- advertising
In all of the above situations, people use probability to decide how likely it is that something will happen
A probability can be described as a fraction, a decimal or a percentage. The probability of any event is given a number between 0 (impossible) and 1 (certain).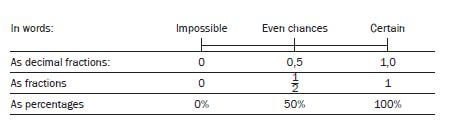
NB
- Probability cannot be bigger than 1! It is always a decimal or a fraction.
The purpose of this scale is to show that there is a continuous range of probabilities. The words are rough descriptions. The numbers give more exact descriptions.
Revise the work on decimals, fractions and percentages in Chapter 1. Remember how to convert between them. Memorise the important ones, for example:
3 = 0,75 = 75%. These are all numbers less than 1.
4
An event has a 50% chance of happening if it is equally likely to happen as not to happen. Tossing a coin is an example: you have a 50% chance of getting heads and a 50% chance of getting tails.
Most things are not as fair as this, though. If you have five T-shirts, three blue and two red, and you take a T-shirt without looking, you have a 3/5 chance of taking a blue one.
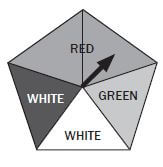
When a coin is tossed, there are two possible outcomes:
- heads (H) or
- tails (T).
We can predict that the probability of the coin landing on H is ½ or 0,5, and the probability of the coin landing on T is ½ .
When a die (or dice) is tossed, there are 6 possible outcomes. Each number (1; 2; 3; 4; 5; 6) has a probability of 1/6 of coming up.
These games of chance help us to understand probability better. These games work with random events, so they are a useful way to learn how to use probabilities to predict events.
Words you need to know
- Frequency: The number of times that something
- Random: When something happens without being made to happen on
- Trial: A Throwing a dice and tossing a coin are examples of a trial.
- Fair: Treated equally, without having an advantage or
- Theoretical probability: The calculated probability, not the actual
The chance of getting T on a coin or 2 on a dice is called the theoretical probability.
When you do a probability experiment, such as tossing a coin a number of times, you are finding the relative frequency of each outcome. For example, if you toss a coin 10 times and you get heads 3 times, then the relative frequency is simply 3 in 10 or 3/10.
What is the chance of throwing an even number on a dice, if you throw the dice once?
This means getting any of the even numbers on the dice. List the correct outcomes: 2; 4; 6.
There are three even outcomes out of six possible outcomes. So the chance is now 50% (which is the same as 0,5 or 1). It is a much bigger chance than throwing only one of the numbers.
A ‘yes’ outcome and a ‘no’ outcome
If we are looking for a particular outcome, such as getting a 4 on a dice, the chances of not getting that outcome can also be worked out.
The probability of getting a 4 is 1/6, so the probability of not getting a 4 is 5/6
e.g. Worked example 1
Write down the chances of getting the outcomes in the following situations. Write your answers as decimals, percentages and common fractions.
You must give all three.
- Getting any odd number when throwing a dice once
- Getting a 3 when throwing a dice with 8 faces
- The arrow of this spinner lands on a colour randomly when you spin What are the chances of landing on red?
- You take out a T-shirt (without looking!) from a pile which has 1 blue, 3 green and 2 purple T-shirts in What are the chances of taking out a purple T-shirt?
Solutions
- The odd numbers on a dice are 1; 3; 5. So there are 3 numbers. There are six numbers in total, so the chances are 1/2 = 0,5 = 50%
- The 3 is only one number out of a total of 8 possible numbers. So the probability is 1/8 = 0,375 = 37,5%
- Two of the parts are red. There are five parts in total. So the total probability is 2/5 = 0,4 = 40%
- There are 2 purple t-shirts. There are 6 t-shirts in total. This means the probability of taking out a purple ones is 2/6 = 1/3 = 0,33 .... = 331/3%
Fair and unfair games
Do you think games of chance are always fair?
- Some games are designed to be Do gamblers have a good chance of winning? Are you more likely to win if you are luckier?
- Games in a casino are designed so that the player has a small chance of winning. Every now and then, the player wins, which gives them confidence to carry on playing! However, if the game is weighted towards one player (usually the owner of the casino!), then that person will win much more often than they
- When you know the chance of a particular event, then you can make predictions about the probability of it happening. A fair game is a game in which there is an equal chance of winning or We can say that if a game is fair then the probability of winning is equal to the probability of losing.
- If you change the rules, you can make the game less fair. For example, if someone wins a game of dice only if they get a 3, is it a fair game?
NB
There is no such thing as luck! The chances remain the same.
e.g. Worked example 2
- A gambler bets her money on getting the number 20 on a roulette wheel in a There are 36 numbers on the wheel. If she loses, the casino takes her money.
What are her chances of losing the bet? Write your answer as a percentage, rounded off to one decimal place. - She has noticed that 20 has come up often in the previous spins of the wheel. Explain to her why this does not mean that 20 is more likely to come up
Solutions
- Losing the bet means not getting a 20. The number 20 is one number out of 36.
So the percentage of losing her bet is 35 out of 36 = 35/36 × 100% = 97,2%. - The probability of not getting a 20 is always 97,2%. It is random, and the fact that she has seen a few 20s has no effect on future events.
A tree diagram is a useful way to show all possible outcomes. If we flip a coin there are two possible outcomes. There is a probability of 1/2 of getting Heads and a probability of 1/2 of getting Tails.
The branches of a tree diagram show these probabilities.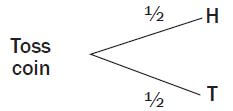
If we roll a dice the tree diagram would look like this.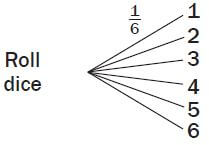
There is a 1/6 chance of getting each number.
Let’s take these two situations mentioned above and combine their outcomes. We are going to flip the coin once and throw the dice once. We now have a combined event.
Let’s look at how a tree diagram is used to show combined outcomes.
e.g. Worked example 3
The tree diagram below shows all the possible outcomes for tossing a coin and then throwing a dice.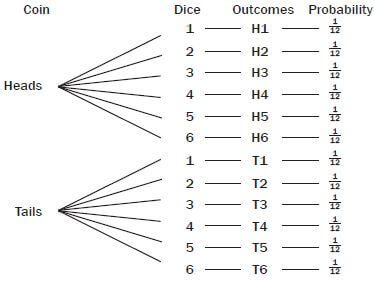
- How many possible outcomes are there? List them
- What is the probability of getting each outcome? Write this probability as a fraction, a decimal (rounded off to 2 decimal numbers) and a percentage
- How many of the 12 possible outcomes include getting an even number on the dice?
- How many of the 12 possible outcomes include getting Tails and an even number?
- How many of the 12 possible outcomes include getting a 5 on the dice?
Solutions
- There are 12 possible outcomes altogether: H1, H2, H3, H4, H5, H6, T1, T2, T3, T4, T5, T6.
- The probability is 1/12 = 0,08 = 8%.
- Six possible outcomes (H2; H4; H6; T2; T4; T6).
- Three possible outcomes (T2; T4; T6).
- Two possible outcomes (H5 and T5).
e.g. Worked example 4
The Moyanas are planning to have three children. A tree diagram showing all possible combinations of boys and girls in a family of three children has been drawn below.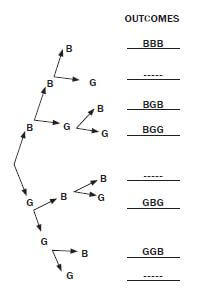
- Complete the tree diagram by filling in the missing outcomes
- What is the probability of the Moyanas having at least two girls?
- List ALL the outcomes where she can have two boys and one girl
Solutions
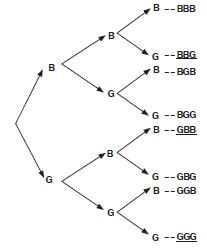
- Completed tree diagram:

- “At least” means 2 or 3 girls. The probability is 4/8 = 50% = 0,5.
- BBG, BGB and GBB.
Activity 1: Using a tree diagram
Sandwiches will be prepared for morning tea. The sandwiches are made from an equal number of white (W), brown (B) and whole-wheat (H) loaves of bread. The fillings used for the sandwiches are egg (E) or fish (F), with (M) or without (N) mayonnaise.
An incomplete tree diagram which could be used to work out the different combinations of sandwiches that could be made, is given below.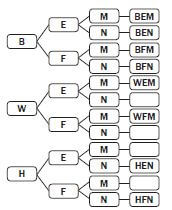
- Explain what the outcome BEM represents on the tree diagram. (1)
- Complete the tree (4)
- Use the tree diagram to write down the probability in simplified form that a sandwich selected at random would:
- be a whole-wheat fish sandwich without (2)
- not be a white bread (2) [9]
Solution
- BEM means brown bread with egg and mayonnaise. ✓ (1)
- The following should be found on the tree diagram:
(a) WEN ✓
(b) WFN ✓
(c) HEM ✓
(d) HFM ✓ (4) - (a) 1/12 OR 0,08 OR 8,33% ✓✓ (2)
(b) 8/12
= 2/3 OR 0,67 OR 66,67% ✓✓ (3)
7.4 Using a two-way table to show combined outcomes
A two-way table (also known as a contingency table) works in a similar way to a tree diagram. We write the outcomes of one event in rows and the outcomes of the other event in columns.
For example, this table shows all the possible combinations for tossing a coin twice.
H | T | |
H | H, H | H, T |
T | T, H | T, T |
Can you see that there are 4 possible outcomes?
Each block in the table will show a possible outcome of the combined events. Let’s look at a worked example to understand this better.
e.g. Worked example 5
Pumeza collects information about the cats and dogs that learners in her class have as pets. There are 30 learners. For each learner, there are four possible responses. She collects the following information below.
- The learner has a cat and a dog: 5
- The learner has a cat but not a dog: 6
- The learner has a dog but not a cat: 12
- The learner does not have a cat or a dog: 7
Show this information in a two-way
Solution
Has a dog | Does not have a dog | |
Has a cat | These learners have both a cat and a dog: 5 | These learners have a cat but not a dog: 6 |
Does not have a cat | These learners have a dog but not a cat: 12 | These learners do not have a cat or a dog: 7 |
e.g. Worked example 6
- Draw up a two-way table to show all the possible outcomes for tossing a red dice and a blue
- How many possible outcomes are there?
- Now answer the following
- What is the chance of rolling a 3 on the blue dice (and any number on the red dice)?
- Write the probability of getting a 5 on the blue dice as a fraction, a decimal fraction and a percentage (round off your answers to 2 decimal places).
- What is the chance of rolling a 4 on the red dice and a 2 on the blue dice?
- What is the chance, in a single roll of both dice, of getting a 1 and a 2 of either colour?
Solutions
- For tossing a red dice and a blue dice we would have:
For example, (B1; R3) represents rolling a 1 on the blue dice and a 3 on the red dice.Blue/ Red
R1
R2
R3
R4
R5
R6
B1
(B1; R1)
(B1; R2)
(B1; R3)
(B1; R4)
(B1; R5)
(B1; R6)
B2
(B2; R1)
(B2; R2)
(B2; R3)
(B2; R4)
(B2; R5)
(B2; R6)
B3
(B3; R1)
(B3; R2)
(B3; R3)
(B3; R4)
(B3; R5)
(B3; R6)
B4
(B4; R1)
(B4; R2)
(B4; R3)
(B4; R4)
(B4; R5)
(B4; R6)
B5
(B5; R1)
(B5; R2)
(B5; R3)
(B5; R4)
(B5; R5)
(B5; R6)
B6
(B6; R1)
(B6; R2)
(B6; R3)
(B6; R4)
(B6; R5)
(B6; R6)
- There are 36 possible outcomes.
- (i) The chance is 6/36 = 1/6.
(ii) The probability of getting a 5 on blue dice = 1/6 = 0,17 = 16,67% - There is only one block on the table for this: (B2; R4), so there is a 1 in 36 chance of this outcome.
- To get a 1 and a 2: could be (B1; R2) or (B2; R1), so there are two possible outcomes and hence a 2 in 36 This simplifies to 1 in 18 or 1/18 .
Activity 2: Using a two-way table
You are putting together a gift pack for toddlers at a day-care centre. There are four possible toys, and a green, red or yellow box to pack them in. The toys are:
- coloured clay
- colouring-in book and crayons
- mini chalkboard and chalk
- pop-up story
- Look at this two-way table which shows the different gift packs you have made
Green
Red
Yellow
A. coloured clay
10
15
5
B. colouring book and crayons
7
20
3
C. mini chalkboard and chalk
12
25
8
D. pop-up story book
9
19
5
- How many packs are there altogether? (6)
- Which pack do you have the least of? (1)
- Which pack do you have the most of? (1)
- The packs are taken out of a bag randomly and given to each Write your answers as common fractions.
- What are the chances of a child getting any green pack? (2)
- What are the chances of a child getting any yellow pack? (2)
- What are the chances of a child getting a red box with a mini- chalkboard? (1)
- What are the chances of a child getting a green box with coloured clay? (2) [15]
Solutions
- You can complete the table like this to find out:
Green
Red
Yellow
A. coloured clay
10
15
5
30
B. colouring book and crayons
7
20
3
30
C. mini chalkboard and chalk
12
25
8
45
D. pop-up story book
9
19
5
33
Total
38
79
21
138
- There are 138 packs in total. ✓
- The yellow boxes with colouring books and ✓
- The red boxes with the mini-chalkboard. ✓
-
- Use the totals from your table above. There are 38 green packs, so the probability is 38/138 = 19/69. ✓✓
There are 21 yellow packs, so the chances are 21/138 = 7/48 . ✓✓
- 25/138
- 10/138 = 5/69
7.5 Using predictions in various situations
Weather predictions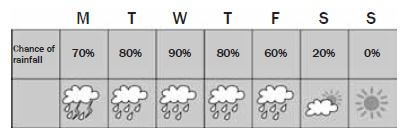
Have you ever wondered what it means when the weather report says, for example, it will be partly cloudy with a 20% chance of rain?
The forecast is based on probability.
Meteorologists use special instruments to measure weather characteristics such as temperature, pressure, humidity, etc. They compare the measurements to data they already have about weather patterns. For example, they would work out that for most days with that sort of weather data, it was partly cloudy and there was rain in 20% of the cases.
Their prediction is based on data accumulated over many years.
They predict all aspects of the weather for the day, not just the probability of rainfall.
e.g. Worked example 7
- If a weather forecast says there is an 80% chance that it will rain in your area, does that mean that you will definitely see rain? Is there a chance that it will not rain where you are?
- How can weather forecasters improve the accuracy of their predictions? Write down two
Solutions
- Forecasters know that it rained on 80% of the days in the past with similar weather conditions, but they can only state a probability, not exactly what will happen. There is also a 20% probability of no
- If there is more data collected over a longer period of time, the prediction will be more Improved methods of measuring the weather characteristics will also give more reliable data.
They can also improve the methods for analysing the data. As computers become more powerful and more specialised, they can improve their methods of analysis.
7.6 False positives and false negatives
Tests such as medical screening tests, pregnancy tests, drug tests and blood alcohol tests are very accurate, but there is always a small probability that the results are wrong. Sometimes there are underlying reasons for the test to be wrong. It is wise to do a test more than once, to increase the probability of a correct result.
When you have a test that can say ‘Yes’ or ‘No’ (such as a medical test), you have to think:
- It could be wrong when the result is ‘Yes’.
- It could be wrong when the result is ‘No’.
Wrong results are called False positives and False negatives. This table shows the four possible situations:
The result is Yes | The result is No | |
The real situation is yes | The test is correct | False negative |
The real situation is no | False positive | The test is correct |
(Remember that an incorrect result is usually very unlikely.)
e.g. Worked example 8
A laboratory tests people for a virus, using a screening test. This is a quick test that works in about 5 minutes.
There is a 0,4% chance that this test will produce a false positive. This means that 99,6% of the time a positive result will indicate a true positive result. The test is therefore 99,6% accurate.
So if a person gets a positive result, a second test must be done to determine if the person does really have the virus.
- (i) Give the possibility of a false positive as a fraction with a denominator of 1000
(ii) If 3 000 people who don’t have the virus are tested, and 0,4% of them test positive, how many people will this be? - A person who tests positive on the quick test is given a second This test takes longer to do, is more expensive and must be done in a laboratory. It has the following accuracy rate, given a sample of 1 000 000 people:
Test positive
Test negative
Total
Carry the virus
4 885
115
5 000
Do not carry the virus
2 630
932 370
995 000
Total
12 515
932 485
1 000 000
(From: Edith Seier and Karl H. Joplin Introduction to statistics in a biological context)’
What is the probability of a person who does not have the virus testing positive in the second test? Write this as a percentage, to one decimal
- Give a possible reason for why people are not tested using the laboratory test the first time
Solutions
- (i) 0,4/100 = 4 out of 1000 = 4/1000
(ii) 4/1000 × 3 = 12 out of 3000 people - If the person does not have the virus, they fall into the category “Do not carry the virus”.
A total of 995 000 people were tested who did not carry the virus.
Of these people, 2 630 tested positive. - The probability is 2630 = 0,0026 = 0,3%
995 000 - The laboratory test is more expensive and it takes longer to do. So it is only used to confirm positive results.
Activity 3: False positives and false negatives
When an athlete takes a drug test, two samples are taken. If the first sample (A) tests positive for drugs, but the athlete believes the test is giving a false positive, they can choose whether to have the second sample (B) screened as well.
Read the extracts from newspaper articles and then answer the questions that follow.
- Extract 1:
Comrades winner fails B-sample drug test
13-JUL-2012 | SAPA | 52 Comrades Marathon winner Ludwick Mamabolo is in danger of losing his title after his B-sample tested positive for methylhexaneamine, the SA Institute for Drug Free Sport (Saids) says.
Mamabolo would face a hearing on a doping charge, according to Saids
Mamabolo’s A-sample tested positive for the banned stimulant after he won the annual 89 km ultra-marathon in Durban last month. - Extract 2:
Comrades winner relieved
2013-05-01 12:20 m.news24.com
Johannesburg - Comrades Marathon champion Ludwick Mamabolo says he is relieved after being cleared of doping charges, more than 10 months after winning the annual ultra-marathon in KwaZulu-Natal.
‘I am delighted that I now have my good name and livelihood back,’ Mamabolo said on Wednesday. I rely on running to support my family.’
Mamabolo tested positive for methylhexaneamine last season, shortly after he became the first South African in seven years to win the Comrades Marathon. His B-sample confirmed the presence of the banned stimulant.
Werksmans Attorneys, which handled Mamabolo’s case, said as many as 15 irregularities were found in the testing process, so Mamabola was found not guilty.
‘We are certain this is the right result for him and for sport,’ said Werksmans Attorneys. - Extract 3:
Marathon Association in bid to improve testing procedures
Wednesday 29 May 2013 14:52, SABC
The Comrades Marathon Association has improved its drug testing procedures to ensure accurate testing for this year’s race.
This comes after last year’s winner, Ludwick Mamabolo, had tested positive for illegal drugs but was later found not guilty after a panel of experts found that the testing process was not up to scratch.
- If the drug test has a 95% accuracy, what is the probability that there is a false positive? (1)
- Imagine that the test has a 95% If the first test gives a false positive, what do you think are the chances that the second test (B sample) is also wrong? Choose from:
- certain
- unlikely
- very unlikely (3)
Explain your answer in full.
- Can we be 100% certain that Mamabola did not take a stimulant? (1) [5]
Solutions
- The probability of the test being wrong is 5% or 0,05. ✓
- The answer is (c) very unlikely ✓. The test is unlikely to get an incorrect result once, ✓ so it is much less likely that it would be wrong twice. ✓ (3)
- We cannot be absolutely certain, as there does exist a very small ✓ possibility that the second test is also incorrect (a false negative). (1) [5]
Activity 4: Mixed questions about probability
1. Read the news article extract carefully and answer the questions that follow: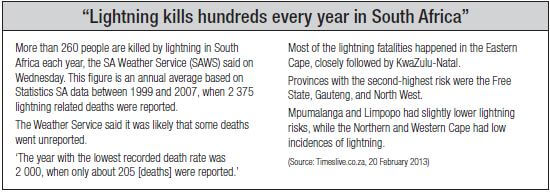
- Where did the SA Weather Service obtain the data for their report that more than 260 people are killed by lightning each year? (1)
- Explain how SAWS obtained the figure of 260 for the number of deaths per year. Show the calculation. (3)
- What kind of statistic is SAWS using when it reports this number? (1)
- SAWS says that it is likely that the number of deaths due to lightning is under-reported. Calculate what the mean would be if the actual number of deaths from 1999 to 2007 was 3 000. (2)
- Were the deaths equally spread out among the nine provinces? Explain. (3)
- Which information did SAWS use in order to arrange the provinces in order of risk? (2)
- Consider these two scenarios of lightning related deaths:
- Scenario A: 100 deaths in one year in a province with a population of 10 000 000
- Scenario B: 20 deaths in one year in a province with a population of 1 000 000
Which of the scenarios indicates a higher probability of death due to lightning? Show your working. (5)
- Some relevant information is not given in this report. Explain. (4) [21]
Solutions
- The data was obtained from Statistics South Africa. ✓
- They took the total number of deaths for all the years, which was 2 375, ✓ and divided it by the number of years between 1999 and 2007.
2 375 ÷ 9 = 263,8 deaths. ✓✓ (3) - The mean. ✓ (1)
- mean = 3 000 ÷ 9 = 333,33 ✓✓ (2)
- No, some provinces have a higher risk than others. ✓ The risk is highest in the Eastern Cape and KwaZulu-Natal. ✓✓ (3)
- The article states ‘Most of the lightning fatalities happened in the Eastern Cape’. This indicates that they used the number of lightning fatalities per province to indicate the risk. ✓✓ (2)
- Scenario A: Probability = 100 ÷ 10 000 000 ✓ = 0,00001 or 1/100000
Scenario B: Probability = 20 ÷ 1 000 000 ✓ = 2/100000 = 1/50000
Scenario B has a much higher risk. ✓ (5) - The report does not state whether the risk numbers ✓ per province were adjusted for the population of the province. ✓ It simply states that the ‘most fatalities’ ✓ occurred in the Eastern Cape. This is also a province with one of the highest populations. ✓ (4) [21]
Activity 5: Mixed questions about probability
Look at the lightning risk map below and read the extract that follows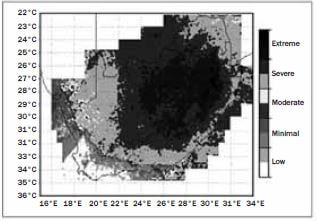
Before 2006, the SAWS (South African Weather Service) was unable to measure lightning activity over South Africa. This limited the SAWS in both its service delivery and public good. This inability changed with the installation of a lightning detection network (SALDN), which enabled the SAWS to explore lightning activity for the first time. These data provide South Africa with the first lightning climatology, based on data for more than a year, measured by the new state-of- the-art SALDN.
Analysis of the maps shows that the highest concentrations of lightning are found over the central to northern interior of the country, with extreme risk areas along the northern escarpment extending from the northern parts of KwaZulu-Natal into the Mpumalanga Lowveld. Almost the entire country is at severe risk from lightning in general. Only towards the west of the country does the concentration of lightning, as well as the lightning risk, decrease.
(Adapted from: http://www.scielo.org.za)
- Compare the sources and types of data in question 1 and the article above. (2)
- Give two reasons why the data in this extract indicates different risks than the article in question 1. (8)
- Which of the articles gives the best estimate of the risks?
Explain your opinion. (2) [12]
Solutions
- Article 1: The data was the number of reported lightning related deaths over nine years, and the source of the data was Statistics South Africa. ✓
Article 2: The data was the lightning density over the country. The source was the SA lightning detection network, which measured the lightning. ✓ (2) - The data set in the second article is the measured lightning density figures, ✓ using the new The risks are measured according to the lightning density, ✓rather than reported deaths. This is apparently a scientific and more accurate method. ✓
The data in the first article was measured up to 2007. The second article uses more up-to-date data. ✓
The risk of lightning-related death is not best given by the number of deaths per province, ✓ because this depends on the number of people in the area, ✓as well as the fact that not all of the data had been reported accurately. ✓
Also note that the first article did not explain whether population figures had been taken into account. ✓ (8) - You need to support your opinion with facts in this question✓The lightning detection network has only been active since 2006. ✓ (2) [12]