MAPWORK QUESTIONS AND ANSWERS GRADE 12
Share via Whatsapp Join our WhatsApp Group Join our Telegram Group
Worked example 1 – straight line distance
Calculate the distance from point A to point B.
| Topographic map calculation: A--------------------------B 1: 50 000 Map distance: 4,6 cm Scale: 1 cm represents 0,5 km Distance: 4,6 cm × 0,5 = 2,3 km | Orthophoto calculation: A----------------------------B 1: 10 000 Map distance: 4,6 cm Scale: 1 cm represents 0,1 km Distance: 4,6 cm × 0,1 = 0,46 km |
Worked example 2 – actual distance
Calculate the distance along the road from point A to point B.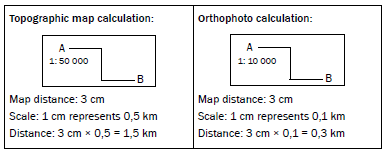
Activity 5.1
Calculate the following distances which are shown on a topographic map.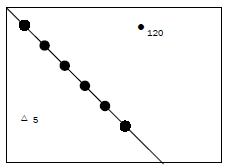
- Calculate the distance from trig. station 5 to spot height 120 in metres. (3)
- Calculate the distance along the powerline in kilometres. (3)
[6]
| Answers to activity 5.1 1. Distance = 4,4 cm3 × 5003 = 2 200 m3 (3) 2. Distance = 6,8 cm 3× 0,53 = 3,4 km3 (3) [6] |
Activity 5.2
Calculate the following distances which are shown on an orthophoto.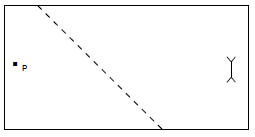
- Calculate the distance from the post office to the dipping tank in metres. (3)
- Calculate the distance along the track in kilometres. (3)
[6]
Answers to activity 5.2
|
Worked example
| Topographic map calculation: | Orthophoto calculation: |
Answer in m² |
Answer in m2 |
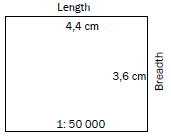
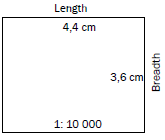
Activity 5.3
- The block below is shown on a topographic map. Calculate the area of the block in metres squared.
 (5)
(5) - The block below is shown on a topographic map. Calculate the area of the block in kilometres squared.
 (5)
(5)
[10]
 (5)
(5)Always write the formula A = L × B. It’s an easy mark.
Answers to activity 5.3
|
Activity 5.4
- The block below is shown on an orthophoto. Calculate the area of the block in metres squared.
 (5)
(5) - The block below is shown on an orthophoto. Calculate the area of the block in kilometres squared.
 (5)
(5)
[10]
Answers to activity 5.4
|
Activity 5.5
Calculate the gradient from trig. station 8 to spot height 1120, which are shown on a topographic map.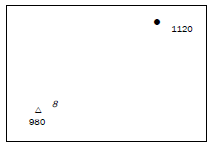
Note that 8 is the number of the trig. station. The height is written below the triangle, i.e. it is 980.
| Answer to activity 5.5 G = H D H: 1 120 − 980 = 140 m D: 4,4 cm × 500 = 2 200 m G: 140 : 2 200 140 140 = 1:15,71 [5] |
Activity 5.6
Calculate the gradient from trig. station 8 to spot height 213, which are shown on an orthophoto. [5]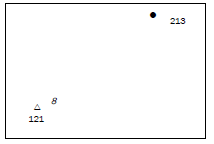
| Answer to activity 5.6 G = H D H: 213 − 121 = 92 m D: 4,4 cm × 100 = 440 m G: 92 : 440 92 92 = 1:4,78 [5] |
Activity 5.7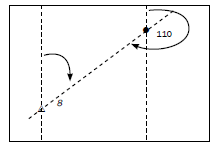
- Calculate the true bearing from trig. station 8 to spot height 110. (2)
- Calculate the true bearing of trig. station 8 from spot height 110. (2)
[4]
Answers to activity 5.7
|
Worked example 1: If the annual change is westwards
Mean magnetic declination (MD) 20º 10’ west of true north (1990.01)
Mean annual change (AC) 2’ westwards (1985–1995)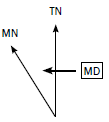
Calculating magnetic declination for 2012
MD = 20° 10’ W of TN
AC = 2’ W
2012 – 1990 = 22 years
22 × 2’ W = 44’ W
MD = 20° 10’ W + 44’ W = 20° 54’ W of TN
Worked example 1: If the annual change is eastwards
Mean magnetic declination (MD) 18º 50’ west of true north (1985.01)
Mean annual change (AC) 1’ eastwards (1980–1990)
Calculating magnetic declination for 2012
MD = 18° 50’ W of TN
AC = 1’ E
2012 − 1985 = 27 years
27 × 1’ E = 27’ E
MD = 18° 50’ W – 27’ E = 18° 23’ W of TN
Worked example 3: If the magnetic declination is given with a decimal place instead of minutes
If the MD given on the map is recorded as a decimal, for example 23°,5 W, you must multiply the number after the comma by 6 to convert it to minutes. For example:
5 × 6 = 30’. So, the MD is now 23°30’ W. The decimal comma has been removed and you have a MD in degrees and minutes.
Now look at the following worked example:
Mean magnetic declination (MD) 18º,3 west of true north (1985.01)
Mean annual change (AC) 1’ westwards (1980–1990)
Calculating magnetic declination for 2012
MD = 18°,3 W of TN = 18° 18’ W of TN
AC = 1’ W
2012 – 1985 = 27 years
27 × 1’ W = 27’ W
Worked example 4: If the magnetic declination answer has the minutes greater than 59’
Once you have done your calculation, if the magnetic declination for the current year has minutes greater than 59’ you need to convert the minutes to degrees.
For example: MD = 23° 76’
76’ – 60’ leaves 16’. The 60 minutes you subtracted equal 1 degree, which you add to the 23° to get 24° 16’.
Now look at the following worked example:
Mean magnetic declination (MD) 31º 33’ west of true north (1990.08)
Mean annual change (AC) 2’ westwards (1987–1993)
Calculating magnetic declination for the current year
MD = 31° 33’ W of TN
AC = 2’ W
2012 – 1990 = 22 years
22 × 2’ W = 44’ W
MD = 31° 33’ W + 44’ W
= 31° 77’ W of TN
= 32° 17’ W of TN
Worked example 5: When the change is eastwards and the change is greater than the minutes in the MD
If the mean annual change has minutes greater than the minutes in the magnetic declination, you need to borrow a degree in the magnetic declination and convert it into minutes. Look at the following example:
MD = 20° 10’ W – 44’ E
Before you can subtract the mean annual change of 44’ E from the given magnetic declination, you need to borrow 1° from 20° and convert it to minutes. This leaves you with 19°. Now take the 1° and convert it to 60’ (remember that 1° = 60’). Now add the 60’ to the 10’. This gives you 70’. Now you can continue with the calculation:
19° 70’ – 44’ E = 19° 26’ W
Now look at the following worked example:
Mean magnetic declination (MD) 25º 32’ west of true north (1986.04)
Mean annual change (AC) 2’ eastwards (1983–1992)
Calculating magnetic declination for 2012
MD = 25° 32’ W of TN
AC = 2’ E
2012 – 1986 = 26 years
26 × 2’ E = 52’ E
MD = 25° 32’ W – 52’ E
= 24° 92’ – 52’
= 24° 40’ W of TN
Remember that 1° = 60’ (1 degree = 60 minutes)
Related Items
- Always add degrees to degrees and minutes to minutes. Never add degrees to minutes.
Example
MD = 18°,8 W = 17° 48’ W
Change in years = 2012 – 1988 = 24 years
Change since 1989 = 24 × 4’ = 96’ W = 1° 36’ W
MD = 17° 48’ + 1° 36’
= 18° 84’ W = 19° 24’ W
TB = between 299° and 303°
MB = TB + MD
= 301° + 19° 24’
MB = 320° 24’
Always write the formula MB = TB + MD in your calculations as this will earn you a mark.
Worked example 1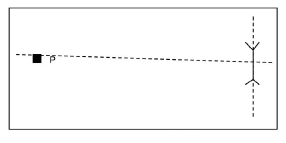
Mean magnetic declination (MD) 20º, 2’ west of true north (2001.09)
Mean annual change (AC) 1’ westwards (1998–2004)
Calculate the magnetic bearing of the post office from the dipping tank for 2012.
MB = TB + MD
TB = 272° (271°– 273°)
MD = 20°, 2 W of TN = 20°12’ W of TN
AC = 1’ W
2012 – 2001 = 11 years
11 × 1’ W = 11’ W
MD = 20° 12’ W + 11’ W = 20° 23’ W of TN
MB = 20° 23’ + 272°
= 291° 23’– 293° 23’
Worked example 2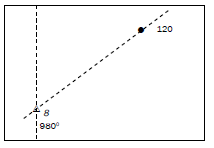
Mean magnetic declination (MD) 20º 31’ west of true north (1998.10)
Mean annual change (AC) 4’ westwards (1995–2001)
Calculate the magnetic bearing from trig. beacon 8 to spot height 120 for 2012.
MB = TB + MD
TB = 57° (56°– 58°)
MD = 20°31’ W of TN
AC = 4’ W
2012 – 1998 = 14 years
14 × 4’ W = 56’ W
MD = 20° 31’ W + 56’ W
= 20° 87’ W of TN
= 21° 27’ W of TN
MB = 21° 27’ + 57°
= 77° 27’ – 79° 27’
Example 1
For the map title 3318CD Cape Town: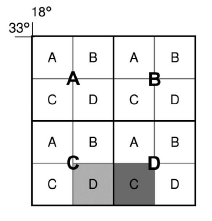
Give the map sheet reference to the east of 3318CD.
- The block to the east of 3318CD (light shading) is block C (darker shading).
- This block is still within the 33° latitude and 18° longitude area, so the numbers (3318) stay the same.
- But it is now in big block D, so the letters change to DC.
- The map sheet to the east of 3318CD is 3318DC.
Practise this type of question by trying the following:
Answers:
|
Example 2
For the map title 3318CD Cape Town.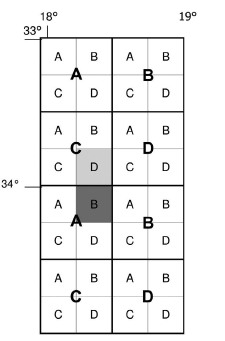
Give the map sheet reference to the south of 3318CD.
- The block to the south of 3318CD (light shading) is the block B (darker shading).
- This block is out of the 33° latitude area and in the 34° latitude area. However, the block is still within the 18° longitude area. The latitude changes but the longitude stays the same (3418).
- It is now in big block A, so the letters change to AB.
- The map sheet to the south of 3318CD is 3418AB.
Always look for a grid showing the map sheet reference at the bottom of a map sheet. It may also provide you with information to help you answer other questions.
Practise this type of question by trying the following:
Answers:
|
When answering this type of question, take note of the following:
- If you are asked for the grid reference north and you go north (up) out of the big block, the latitude must decrease by 1°.
- If you are asked for the grid reference south and you go south (down) out of the big block, the latitude must increase by 1°.
- If you are asked for the grid reference east and you go east (right) out of the big block, the longitude must increase by 1°.
- If you are asked for the grid reference west and you go west (left) out of the big block, the longitude must decrease by 1°.
Worked example 1
Calculate the vertical exaggeration for a cross section drawn on a topographical map with a vertical scale of 1 cm = 50 m.
Answer
VE = VS ÷ HS
VS: 1 cm = 50 m
1 cm = 50 × 100 cm = 5000 cm
VS 1:5 000
VS 1
5 000
HS 1:50 000
HS 1
50 000
VE = 1 ÷ 1
5 000 50 000
VE = 1 × 50 000
5 000 1
VE = 50 000
5 000
VE = 10 times
Always write the formula VE = VS ÷ HS as this will earn you a mark.
Worked example 2
Calculate the vertical exaggeration for a cross section drawn on an orthophoto map with a vertical scale of 1 cm = 25 m.
Answer
VE = VS ÷ HS
VS: 1 cm = 25 m
1 cm = 25 × 100 cm = 2 500 cm
VS 1:2 500
VS 1
2 500
HS 1:10 000
HS 1
10 000
VE = 1 ÷ 1
2 500 10 000
VE = 1 × 10 000
2 500 1
VE = 10 000
2 500
VE = 4 times
Example 1
In Figure 5.3.6 below, is point Q intervisible from point P?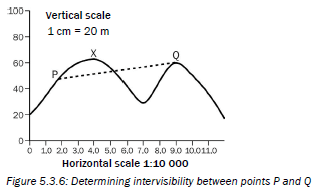
The answer is that there is no intervisibility between P and Q, as the line cuts through the cross-section (goes through the mountain). This means you cannot see point Q from point P, and you cannot see point P from point Q.
Example 2
In Figure 5.3.7 below, is point X intervisible from point Q?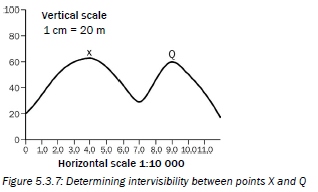
The answer is there is intervisibility between X and Q, as the line does not cut through the cross-section. This means you can see point X from point Q, and you can see point Q from point X.
Activity 5.8
Refer to the topographical map and orthophoto of Nelspruit at the back of this study guide to answer the following questions:
- Calculate the area covered by block B3 on the Nelspruit topographical map in kilometres squared. (5)
- Calculate the magnetic bearing for 2012 from trig. beacon 101 (C3) to spot height 676 (C4) on the topographical map. Show all steps followed (calculations). Marks will be allocated for calculations. (10)
- Calculate the gradient between trig. beacon 101 in block C3 and spot height 676 in block C4. (5)
[20]
Check how well you can do mapwork calculations by completingactivity 5.8.
Answers to activity 5.8
- Area = length × breadth
= (3,7 cm × 0,5) km × (3,3 cm × 0,5) km
= 1,85 km × 1,65 km
= 3,05 km2(5) - Magnetic declination: 15°02' west of true north
Annual change: 03' E
Number of years: 2012 – 1986 = 26 years
26 × 3' = 78' E = 1° 18' E
Magnetic declination: =15°02' W – 1°18' E
= 14° 62' W – 1° 18' E
= 13°44' W
Magnetic bearing = True bearing + Magnetic declination
= 102° + 13° 44' W
= 115° 44' (10) - Gradient = Height = H
Distance D
H = 754,4 – 676 = 78,4 m
D = 5,6 cm × 500 = 2 800 m
G = 78,4 : 2 800
78,4 78,4
G = 1:35,73 (5)
[20]
Activity 5.9
Refer to the topographic map 2530BD Nelspruit and the orthophoto map extract at the back of this study guide to answer the following questions.
- Underline the correct term that matches the description below:
- Data that refers to the actual position of an object is vector/raster data. (1 × 2 = 2)
- Data that is stored in pixels is vector/raster data. (1 × 2 = 2)
- Refer to block B1 on the 2530BD Nelspruit topographic map. Give an example from this block of the following:
- Point feature (1 × 2 = 2)
- Line feature (1 × 2 = 2)
- Polygon feature (1 × 2 = 2)
- List any four layers that were used to draw this topographic map. (4 × 2 = 8)
[18]
Answers to activity 5.9
|