ElimuZA Access to Education
THE DYNAMICS OF IMPERFECT MARKETS QUESTIONS AND ANSWERS GRADE 12
Share via Whatsapp Join our WhatsApp Group Join our Telegram GroupActivity 1
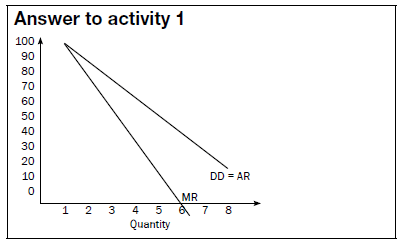
Use the table below of a typical monopolist and plot the revenue curves on the same set of axes. Notice the position of the Marginal revenue curve in relation to the Demand curve.
| Price | Quantity | Total revenue | Average revenue | Marginal revenue |
| - | 0 | 0 | 0 | 0 |
| 100 | 1 | 100 | 100 | 100 |
| 90 | 2 | 180 | 90 | 80 |
| 80 | 3 | 240 | 80 | 60 |
| 70 | 4 | 280 | 70 | 40 |
| 60 | 5 | 300 | 60 | 20 |
| 50 | 6 | 300 | 50 | 0 |
| 40 | 7 | 280 | 40 | -20 |
| 30 | 8 | 240 | 30 | -40 |
Activity 2
Complete the following table by filling in the missing information:
| Characteristics | Perfect market | Monopolistic competition | Oligopoly | Monopoly |
| So many competitors that a singlebusiness cannot influence the market price | So few competitors that each business takes the actions of the others into account | |||
| Market entry | Completely free | Free | ||
| Downward sloping | ||||
| Long-term economic profit | Positive | |||
| Seller market power | ||||
| Control over price | Some control | Considerably more than oligopoly | ||
| Examples | Fast-food outlets | Eskom |
[20]
Answer to activity 2
| Characteristics | Perfect market | Monopolistic competition | Oligopoly | Monopoly |
| Number of businesses | So many competitors that a single business cannot influence the market price | A very large number | So few competitors that each business takes the actions of the others into account | One business |
| Market entry | Completely free | Free | Free to restricted | Blocked |
| Demand curve | Slopes from left to right | Downward sloping | Downward sloping | Downward sloping = market demand |
| Long term economic profit | Normal profit | Normal profit | Positive | Positive |
| Seller market power | None, price-taker | Some | A whole lot | Many (price-maker) |
| Control over price | None | Few | Considerable | Considerably more than oligopoly |
| Examples | Gold and oil | Fast-food outlets | Petrol and oil | Eskom |
[20]
Activity 3
Study the following graph and answer the questions that follow:
- Define the term imperfect market. (2)
- Motivate why the above graph indicates short-term equilibrium. (4)
- Which point on the graph indicates profit maximisation? (2)
- Calculate the economic profit. (6)
[14]
Answers to activity 3
|
Published in Economics Grade 12 Study Guides and Notes