THE REASONS FOR AND CONSEQUENCES OF MARKET FAILURES GRADE 12 NOTES - ECONOMICS STUDY GUIDES
Share via Whatsapp Join our WhatsApp Group Join our Telegram Group- Key concepts
- The reasons for market failures
- Consequences/effects of market failures
- Cost-benefit analysis (CBA)
Markets can fail for many reasons. The reasons for, and consequences of, market failure are explained in this Topic.
Overview
| TOPIC | CONTENT | SCOPE AND DEPTH OF EXAMINABLE CONTENT |
| 8. Dynamics of markets: Market failures | Explain the reasons for and consequences of The causes of market failures
Missing markets
Imperfect competition
Immobility of factors of production
Imperfect distribution of income and Consequences of market failures
Cost-benefit analysis
|
HOT QUESTION: Draw a fully labelled HOT QUESTION: Why do governments
HOT QUESTION: Draw two graphs to
HOT QUESTION: Present a case for the |
8.1 Key concepts
These definitions will help you understand the meaning of key Economics concepts that are used in this study guide. Understand these concepts well.
| TERM | DEFINITION |
| Allocative Inefficiency | When resources are not allocated in the right proportions and the product mix does not match consumers’ tastes. It is possible to reallocate resources to make one person better off while not making someone else worse off |
| Allocative/Pareto Efficiency | Occurs when resources cannot be readjusted to make one consumer better off without making another consumer worse off. There is zero opportunity cost |
| Black market | An illegal market in which illegal goods are bought and sold or illegal prices are charged |
| Cost-Benefit Analysis | An analysis done by government which weighs the costs and benefits of a project to determine whether it should be carried out |
| Demerit Goods | Goods that are seen to be socially harmful e.g. cigarettes, gambling |
| Externalities | Costs or benefits to third parties which are not included in the market price of a good |
| Market Failure | When the forces of demand and supply fail to allocate resources efficiently |
| Maximum Price/ Price Ceiling | A price set below the equilibrium price/market price to make goods affordable |
| Merit Goods | Goods that are so beneficial to society that every individual should consume them irrespective of their income e.g health care, education |
| Minimum Price/ Price Floor | A price set above the equilibrium price/market price to allow producers to make a fair profit |
| Minimum Wage | A wage rate set by the government, below which no employer can pay their workers. It is set above the equilibrium wage rate |
| Negative Externalities | A cost to a third party which is not included in a market price of a good. It is a difference between social cost and private cost. E.g. the harmful effect of a product e.g. pollution |
| Non-Excludable Goods | Goods whereby individuals can benefit even if they do not pay for it e.g. the television or the police force |
| Non-Rival Goods | Goods when consumed by one person will not reduce the consumption by another individual e.g. street lights |
| Positive Externalities | The benefit gained by a third party which is not included in the market price |
| Private Benefit | The gain a consumer gets from the use of a goods or the gain a producer gets from the sale of a product. E.g. The joy gained by a consumer from driving a car |
| Private Cost | The actual cost paid by a consumer when a good is purchased. E.g. R150 000 for a car |
| Producer Subsidies | A cash allowance given to a producer to lower the cost of production and allow more goods to be supplied at a lower price |
| Productive/ Technical Inefficiency | When resources are not used appropriately to produce the maximum number of goods at the lowest cost and best quality |
| Public Works Programme | A government initiative aimed at reducing poverty by creating temporary jobs in areas of infrastructure and other areas |
| SABS – South African Bureau Of Standards | An institute that monitors the quality of goods in South Africa |
| Social Benefit | The benefit gained by society from the use of a good or service. E.g. taxpayers pay for the maintenance of roads, society will benefit from fewer accidents. It is calculated by adding the private benefit and external benefit |
| Social Cost | The cost of a good or service which is paid by society. It is calculated by adding the private cost and external cost. E.g. the air pollution caused by cars, will affect people’s health bills |
8.2 The reasons for market failures
There are many reasons for market failure. These include:
8.2.1 Externalities
Externalities are costs not included in the pricing of goods/services, and consequently there is a difference between the private costs/benefits and the social costs/benefits of production.
- Private costs: the cost of producing the good or service which translates into the prices that consumers pay. Also called internal costs.
- Private benefits: Internal benefits that accrue to those who produce goods and buy these goods, e.g. producing a bicycle (for producer) and using the bicycle (consumer).
- Social costs: these are total costs incurred by society as a whole. For example the social cost of electricity includes the cost of capital, labour, inputs and the cost of the externalities such as dirty water and air. Social cost = private costs plus external costs.
- Social benefits: this includes the total benefit experienced by society as a whole. For example, municipalities provide clean water to society which results in fewer illnesses. Social benefits = private benefits plus external benefits.
Negative externalities are things like pollution, tobacco smoking and alcohol abuse. The costs of negative externalities are paid by society rather than by the producers. For example, Styvesant produces cigarettes, many illnesses are related to smoking. The treatment for these illnesses is paid for by society.
Positive externalities are the positive effects of products to third parties which are not paid for.
Negative externalities are often over-produced while positive externalities are under-produced. This leads to market failure.
8.2.2 Missing markets
Markets are incomplete because they cannot meet the demand for certain goods. Public goods (community and collective goods) are in high demand but are not supplied by the market because of the low profit gained from them and the high cost of capital needed to supply them. Since private producers cannot withhold these goods for non-payment, they are reluctant to provide these goods. The government thus provides these goods and services.
Public goods
This includes community and collective goods and has two features:
- Non-rivalry: Consumption by one person does not reduce consumption by another individual, e.g. a lighthouse.
- Non-excludability: Consumption can’t be confined to those who pay for it (free riders can use them), e.g. radio and television.
When you buy a product in a polystyrene container, this gives rise to a negative externality – pollution! This is a form of market failure.
In addition
- Social benefits outstrip private benefits: e.g. health care and education.
- Non-rejectability: Individuals are not able to abstain from consumption, e.g. street lighting.
- Continuous consumption. E.g. traffic lights.
Community goods
These are goods such as, defence, police services, prison services, street lighting, flood control, storm water drainage and lighthouses.
Collective goods
These are goods such as parks, beach facilities, streets. Markets are incomplete and cannot meet the demand for all goods. Government provides public goods, which consist of:
Merit and demerit goods
- Merit goods: These are highly desirable for general welfare, but not highly rated by the market, e.g. health care, education and safety. If people had to pay the market price for them, very little would be consumed. The market fails because the market produces less than the desired quantity.
- Demerit goods: These are over-consumed goods, e.g. cigarettes, alcohol and drugs. Thus more of the good is produced than is socially desirable. The government bans or reduces consumption of these products through taxation, and provides information to the population on their harmful effects.
8.2.3 Imperfect competition
- Competition in market economies is limited by the power of certain producers to prevent new businesses from entering the market. This is imperfect competition.
- Barriers to entry are created because of advertising, a lack of capital and the controlling of resources.
- The imperfect market doesn’t allow for price negotiations.
- Advertising is used to promote producer sovereignty (dominance), which encourages consumers to buy existing products and allows producers to delay new products from entering the market until it is in their own interest (e.g. businesses have had the technology to produce long-life light bulbs for many years but have chosen not to launch them in the market).
8.2.4 Lack of information
Consumers, workers and entrepreneurs do not have the necessary information to make rational decisions. This results in resources not being allocated efficiently.
- Consumers: To maximise their benefits, consumers need detailed information about goods and services. Although technology offers this to the consumer, they obviously do have perfect information.
- Workers: Are often unaware of job opportunities.
- Entrepreneurs: Lack of information on costs, availability and productivity of factors of production impacts their effectiveness.
Merit and demerit goods relate to desirability of use
8.2.5 Immobility of factors of production
- Labour takes time to move from one area to another.
- The supply of skilled labour cannot be increased because of the time it takes to be trained or educated.
- Physical capital, like factory buildings or infrastructure such as telephone lines cannot be reallocated easily.
- Structural changes like a change from producing plastic packets to paper packets or shifting from labour-intensive production to computer based production requires a change in labourers’ skills, employment and work patterns. This takes time to change.
8.2.6 Imperfect distribution of income and wealth
- Income distribution: The market system is neutral on issues of income distribution.
- Discrimination: Distorts earnings for women and minority groups, disabled persons and people subject to illness and incapacity.
- The market produces goods and services only for those who can afford it.
- This leads to some people having too many goods while others have too few goods.
- The difference in income occurs because there is a difference in market power, unequal educational opportunities, discrimination and inheritance.
The market can be efficient but not necessarily fair or equitable
8.3 Consequences/effects of market failures
8.3.1 Inefficiencies
Two kinds of inefficiencies are possible:
- Productive inefficiency/Technical inefficiency
When resources are not used appropriately to produce the maximum number of goods at the lowest cost and best quality. - Allocative inefficiency
Allocative inefficiency means that the types/quantities of goods or services produced are not what is best for consumers.
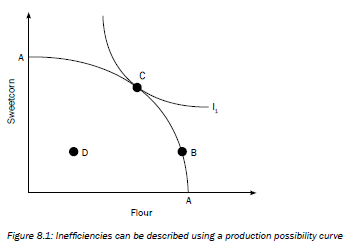
- The Production possibility curve (AA), above, shows a combination of goods that can be produced using all the available resources.
- Any point on the curve shows a combination of goods where resources will be used efficiently.
- Therefore any point on the curve indicates Productive/Technical efficiency.
- The indifference curve (I1) shows a combination of two goods which gives the consumer the same level of satisfaction. However, if production takes place at point B on the curve, but the demand for goods is actually represented by point C, Allocative inefficiency will occur where the tastes of consumers are not met.
- Any point to the left of the curve such as D, indicates that some resources are unused. If this occurs some customers may be deprived of goods. This depicts Allocative and Productive inefficiency.
Pareto optimum A situation where it is impossible to increase the welfare of one individual without making another worse off. This implies that the welfare of the community is at its maximum.
Learn these four consequences of market failure.
8.3.2 Externalities (spill-over effects)
Negative externalities
Negative externalities bear a private cost, the cost of producing the actual product and a social cost, a cost suffered by society. If the social cost of a good were added to the private cost of a good, the final price would be pushed up and fewer goods would be supplied. This is depicted in Figure 8.2 below.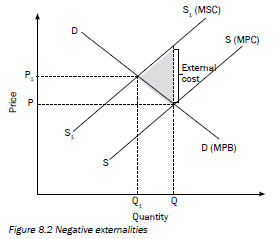
From the graph it can be seen:
- The demand for the cigarettes is represented by DD.
- The supply of the product, which is also the marginal private cost (MPC) of the industry, is represented by SS.
- As a result of the pollution, the marginal social cost (MSC) is greater than MPC.
- If the market is left to its own devices, a quantity Q will be produced at price P.
- This is a socially inefficient solution.
- Social efficiency requires that MSC be equal to the price of the product.
- This occurs at price P1 and quantity Q1.
- Fewer goods should be produced at a higher price.
- The shaded angle represents the negative externality (welfare loss) to society.
The government has used three methods to reduce negative externalities:
- The government has carried out campaigns in order to change/ persuade people from causing negative externalities.
- Levying taxes on goods that cause negative externalities. E.g. Taxes are levied on cigarettes and alcohol.
- Passing laws and regulations to prevent activities that cause negative externalities. E.g. Tobacco companies are not allowed to advertise. There are laws that regulate the amount of air pollution and waste.
Positive externalities
If people acknowledged the social benefit of a good, they would demand more of that good. The price of such a good would therefore increase. This is depicted in the Figure 8.3 below.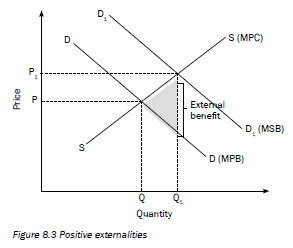
From the graph it can be seen:
- The supply of education, which is also the marginal social cost, is represented by SS.
- The demand for school education, which is also the marginal private benefit (MPB) of the industry, is represented by DD. The cost of school fees is P and the quantity demanded and supplied is Q.
- If the cost of school fees is P, most learners will not be able to afford it.
- The demand curve D1D1 also represents the marginal social benefit. (MSB), that is, the level of education that should be demanded.
- As a result of the benefits of education, MSB is greater than MPB.
- If the market is left to its own devices, a quantity Q will be produced at price P.
- There would be social inefficiency in the market since not enough education is being demanded.
- However, if social benefits are acknowledged, a quantity Q1 will be produced at price P1.
- More education would be demanded, this will lead to social efficiency.
- The shaded angle represents the positive externality (the welfare gain) to society.
The government encourages positive externalities by:
- Advertising on the radio or television.
- Providing education, health care and other services at a low cost or free.
- Providing consumer subsidies.
- Consumer subsidies lower the cost of a good and encourage its usage.
8.3.3 Government intervention
Rules and regulations
- Direct controls
The government can pass laws or use existing legislative framework to control businesses that generate negative externalities. - Imperfect markets
Firms in an imperfect market supply a limited quantity of goods and services at a very high price.
The government uses its laws on competition to prevent exorbitant prices charged by firms, to ensure entry to the market is free, prevent harmful collusion and encourage foreign competition which helps keep prices of goods low. - Establishing minimum wages
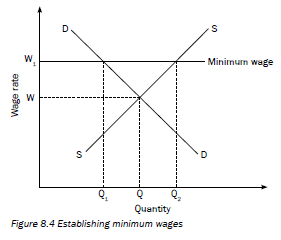
- When the government enforces a minimum wage, it means workers have to be paid a certain wage amount and not anything less than this.
- The Figure 8.4 below shows that if the wage rate is set at W, the corresponding demand and supply of labour will be Q.
- If a minimum wage of W1 is set, the demand for labour will decrease from Q to Q1. Some people may become unemployed due to the introduction of a minimum wage.
- However, the quantity of labour supplied will increase from Q to Q2.
- More people will offer their labour because of the higher wage.

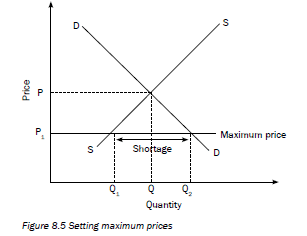
- Setting maximum prices/price ceilings
- The government sets a maximum price ceiling below the market price to make goods more affordable.
- Maximum prices allow the poor greater access to certain goods and services.
- A maximum price is set on goods such as basic foods, housing and transport.
- In South Africa the price of petrol, diesel fuel and paraffin are controlled at their maximum prices.

- Initially the market equilibrium price is P and equilibrium quantity is Q.
- The government intervenes and passes a law that milk cannot be sold for more than P1.
- The effect of this maximum price is that quantity supplied decreases to Q1 and quantity demanded increases to Q2.
- There is a shortage of milk equal to the difference between Q1 and Q2.
- A shortage creates a problem of how to allocate milk to consumers. Black markets often develop where people can obtain milk. A black market is an illegal market in which either illegal goods are bought and sold or illegal prices are charged.
- Maximum prices may cause a shortage of goods but they do improve the welfare of some consumers since goods can be purchased at lower prices.
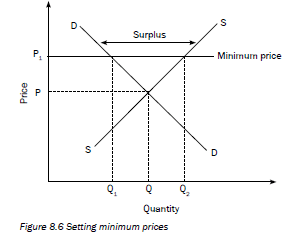
- Setting minimum prices/price floors
- The government sets a minimum price at some point above the market price.
- This is done to enable producers to make a comfortable profit and thus encourages them to supply important essential goods.

- Consider the market for wheat.
- The market equilibrium price is P and the equilibrium quantity is Q.
- If the government sets a minimum price at P1, farmers will be earn greater profits and supply more wheat. Quantity supplied will therefore increase to Q2.
- However, quantity demanded will decrease to Q1.
- There would be a surplus of wheat equal to the difference between Q2 and Q1.
- A surplus means the government will have to buy the extra wheat and dump it locally or abroad.
- Although minimum prices may cause a surplus they do encourage the supply of important food stuffs.
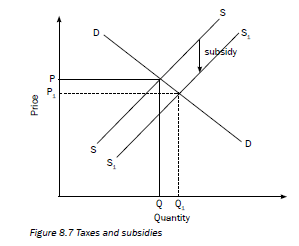
- Taxes and subsidies
Levying of taxes
Governments intervene in the market by levying taxes to recover the external cost. These taxes will increase the price and will result in a decrease in production. This could help to reduce a negative externality such as pollution.
Providing Producer Subsidies- The government provides subsidies to producers in order to encourage them to increase the production of goods. Supply increases.
- Producer subsidies are often given to suppliers of agricultural products such as milk, wheat and maize.
- Subsidies lower the cost of producing goods and thus the market price of these goods is lowered.

For example, if we look at Figure 8.7: - The market price of rice is P and the corresponding quantity is Q.
- If the government subsidises the production of rice, the market price will decrease to P1 with corresponding quantity Q1.
- The lower price, P1, allows the poor to purchase more rice.
- Redistribution of wealth
- Traditional methods e.g. the levying of various taxes and the provision of free services, services in kind and cash benefits to the poor.
- Implementing Redress methods e.g. the use of law to enforce redistribution. It includes BEE, affirmative action, empowerment, land restitution, land redistribution and property subsidies (for RDP houses).
The government can use other ways to improve income distribution and overcome market failure: - Transfers income directly to the poor e.g. child support grants, unemployment benefits etc.
- Provides goods free of charge e.g. community goods, education etc. Implements employment creation programmes e.g. public works programme.
- Subsidising merit goods e.g. subsidising arts and cultural events. Imposes taxes and laws on demerit goods to discourage consumption.
- Uses fiscal and monetary policy to achieve macroeconomic stability.
- Makes sure that consumers are informed about products through legislation. The South African Bureau of Standards (SABS) checks consumer goods in South Africa.
- Tries to prevent misleading advertising. (Advertising Standards Authority)
8.4 Cost-benefit analysis (CBA)
8.4.1 Description
In both private and public sectors project evaluations are done in terms of cost and benefits. In the private sector feasibility studies are done which also provides for legal aspects relating to externalities. Expected private costs and benefits are taken into account.
In the public sector a Cost Benefit Analysis is done which takes into account expected social costs and social benefits of providing such goods and services.
Learn these three points about cost benefit analysis.
8.4.2 Reasons for cost benefit analysis
- Market signals e.g. price help to allocate resources through demand and supply.
- Goods supplied by the government such as roads, bridges etc. are provided free.
- With the absence of market signals, decisions on the desirability of a project may be subjective.
- Objective criteria may be required to ensure economic efficiency in resource allocation.
- CBA brings greater objectivity to decision making.
- This is done by identifying all the relevant benefits and costs of a project so that an informed decision can be made.
8.4.3 Applying the CBA (an example)
CBA is usually applied to projects where it is expected there will be a significant difference in private and social costs and benefits. Imagine the Gautrain project, a rail service that connects Hatfield in Tshwane with Johannesburg and the OR Tambo International Airport.
Private costs would include:
| Private benefits would include:
|
External costs would include:
| External benefits would include:
|
Once all benefits and costs were determined it was eventually decided that the idea of the Gautrain would benefit society more than harm it. Planning for the Gautrain started in 2000 but building only started in 2006.
Activity 1
Study Figure 8.8 and answer the questions that follow.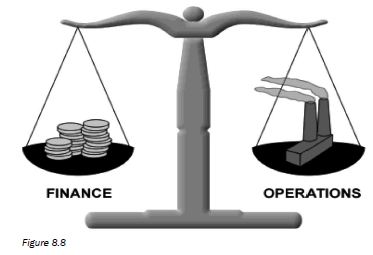
- What economic technique for enumerating and evaluating is depicted in the illustration? (2)
- Give TWO recent examples of potential ‘operations’ in South Africa that will fit into the illustration. (2)
- List ONE social benefit of each of the above projects. (4)
[8]
Answers to activity 1
|
Activity 2
Distinguish between merit and demerit goods. [8]
Answer to activity 2
|
Activity 3
Discuss the features of collective goods. [8]
Answer to activity 3
|
Activity 4
Discuss the distribution of wealth and income as a consequence of market failure. [8]
Answer to activity 4
|
Activity 5
Study the following illustration and answer the questions that follow: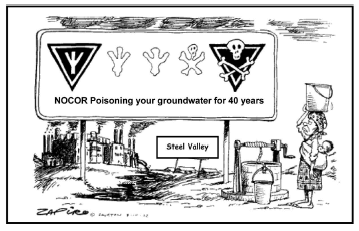
- Identify the negative externality depicted in the illustration. (2)
- List TWO measures that can be applied by government to reduce
this externality. (2) - What is the liability of the factory in this regard? (2)
- What effect will this have on consumer prices? (2)
[8]
Answers to activity 5
|