THE DYNAMICS OF IMPERFECT MARKETS GRADE 12 NOTES - ECONOMICS STUDY GUIDES
Share via Whatsapp Join our WhatsApp Group Join our Telegram Group- Key concepts
- Monopolies
- Output profit and loss
- Oligopolies
- Monopolistic competition
- Summary of market structures
There are a number of different types of imperfect markets, e.g. monopolies, oligopolies and monopolistic competition. An imperfect market is characterised by imperfect competition. Some participants have earlier or exclusive access to information that benefits them in the marketplace at the expense of their competitors. Certain participants will be able to access the market more easily than other participants, i.e. the supply of and demand for products will not be equal, and the matching of buyers to sellers will not be immediate.
Overview
| TOPIC | CONTENT | SCOPE AND DEPTH OF EXAMINABLE CONTENT |
| 7. Dynamics of markets: Imperfect markets | Examine the dynamics of imperfect
Monopolies
Oligopolies
Monopolistic competition
|
HOT QUESTION: Compare a monopoly with a perfect
HOT QUESTION: ‘Collusion is a punishable offence in
HOT QUESTION: Compare monopolistic competition with |
7.1 Key concepts
These definitions will help you understand the meaning of key Economics concepts that are used in this study guide. Understand these concepts well.
| Term | Definition |
| Artificial monopoly | The barriers to entry are not economic in nature, but are caused by other factors. For example, a patent – this is the legal right of a holder to exclusively manufacture a product |
| Cartel | A group of producers whose goal is to form a collective monopoly in order to fix prices and limit supply and competition |
| Collusion | An arrangement between businesses with the aim of limiting competition between them by fixing prices Imperfect market When the market price is not a pure reflection of the scarcity (lack) of that product |
| Legal monopoly | Monopoly based on laws preventing other companies from competing |
| Monopolistic competition | A market structure with many buyers and sellers where entry is relatively easy but the product is differentiated, e.g. toothpaste |
| Monopoly | A market structure where only one seller (producer) operates. Entry is blocked and the product has no close substitutes |
| Natural monopoly | High development costs prevent others from entering the market. A single business can serve the whole market at a lower price due to economies of scale, being large e.g. water and electricity |
| Non-homogenous | Manufacture different variations of their products in order to make it difficult for other companies to copy that specific product |
| Oligopoly | A market structure where only a few sellers operate. Entry is difficult and products can be differentiated or standardised |
| Price leadership | A situation where one firm fixes a price and the others accept it as the market price |
Use mobile notes to help you learn these key concepts. See page xiv in the introduction for more.
7.2 Monopolies
A monopoly exists when there is one seller of a good or service for which there is no close substitute.
7.2.1 Characterictics of monopolies
- There is only one seller of the product
- There are barriers to entry. These are caused by patents and other forms of intellectual property rights, control over resources, government regulations and decreasing costs.
- The monopolist is regarded as a price maker since it is able to influence the market price through changing the quantity it supplies to the market.
- The are no close substitutes. The product cannot be easily replaced.
Consumers have no choice in price and quality of the product. - There is no competition. One business in the market will control the supply of goods and services.
- Products are differentiated and unique. Monopolies manufacture a variety of products which are difficult for other companies to copy.
- Large amounts of starting capital are required. Large industries like Eskom and SASOL require millions of starting capital.
- Monopolies have legal considerations. New inventions are protected by patent rights. Services, like the Post Office are protected by law and other businesses are prohibited from entering the market.
- It is also possible for the monopolist to make an economic profit in the long run. This is because it faces no competition from new entrants as a result of the barriers to entry.
Monopolies can be classified as two main groups due to barriers that exist
Natural monopolies: High development costs prevent others from entering the market and therefore the government supplies the product. E.g. Electricity in South Africa is provided by the government enterprise, Eskom. It costs billions of rands to build and maintain power stations and therefore there are no other suppliers.
Artificial monopolies: Here the barriers to entry are not economic in nature.
An example of a barrier is a patent. A patent is a legal and exclusive right to manufacture a product, e.g. Denel Land Systems manufacturing Casspirs.
7.2.2 The demand curve of the monopolist
- Under perfect competition the individual producer faces a horizontal demand curve where D = MR = AR, since it is a price taker.
- By contrast, the monopolist faces a normal market demand curve which slopes downwards from left to right. Here D = AR.
- It is also the market (or industry’s) demand curve, since the monopolist is responsible for the entire output of the industry.
7.2.3 The marginal revenue curve of a monopolist
- Since a monopolist faces a downward sloping demand curve, its marginal revenue curve and its demand curve are not the same curve as is the case with an individual producer under perfect competition.
- Under perfect competition, the individual producer is a price taker and can sell any quantity at the market price and therefore faces a horizontal demand curve, which is also its marginal revenue curve.
- The demand curve for a monopolist, which is downward sloping, implies that, if it wishes to increase its sales by an additional unit, it must decrease the price of the product.
- The lower price applies to all its customers. Its marginal revenue - that is the amount by which total revenue increases if it sells an additional unit – will therefore be less than the price.
- The marginal revenue curve and the demand curve are therefore not the same curve. The Marginal revenue curve will be lower than the demand curve.
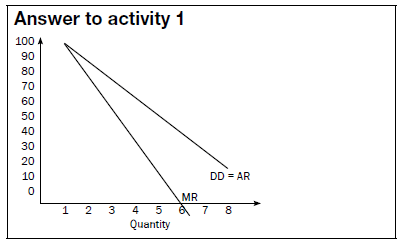
Activity 1
Use the table below of a typical monopolist and plot the revenue curves on the same set of axes. Notice the position of the Marginal revenue curve in relation to the Demand curve.
| Price | Quantity | Total revenue | Average revenue | Marginal revenue |
| - | 0 | 0 | 0 | 0 |
| 100 | 1 | 100 | 100 | 100 |
| 90 | 2 | 180 | 90 | 80 |
| 80 | 3 | 240 | 80 | 60 |
| 70 | 4 | 280 | 70 | 40 |
| 60 | 5 | 300 | 60 | 20 |
| 50 | 6 | 300 | 50 | 0 |
| 40 | 7 | 280 | 40 | -20 |
| 30 | 8 | 240 | 30 | -40 |
7.3 Output profit and loss
7.3.1 Revenue
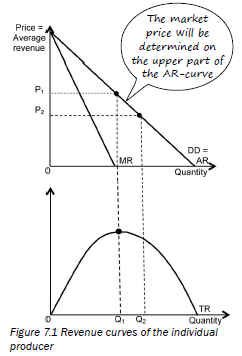
- The demand curve for a monopolist is the market demand curve and slopes downwards from left to right (DD/AR). See the top graph in Figure 7.1.
- Any point on the curve is an indication of the quantity of the product to be sold and the price at which trade takes place.
- Any price-quantity combination on the demand curve is also its average revenue (AR) curve.
- The average revenue from each product is calculated by dividing the total revenue by the quantity = the price. See the bottom graph in Figure 7.1 (left).
- The marginal revenue (MR) curve runs below the demand curve (AR) – it always intersects the horizontal axis at a point halfway between the origin and the point of intersection of the demand curve (AR).
- The monopolist will try to fix the price above the centre of the demand curve, because only then will his total revenue increase. See Figure 7.1. Note how at Q1 total revenue is at its highest. Q1 intersects the demand curve of the top graph above the centre of the curve.

The market price will be determined on the upper part of the AR-curve
7.3.2 Economic profit in the short term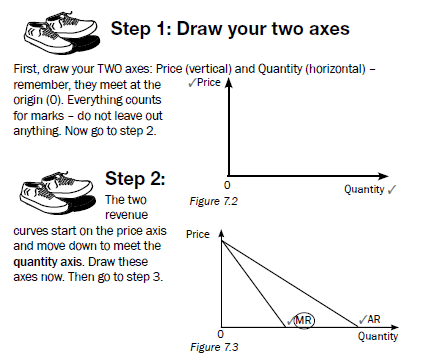
Step 3:
This MC curve intersects the AC curve at the minimum point of the AC curve.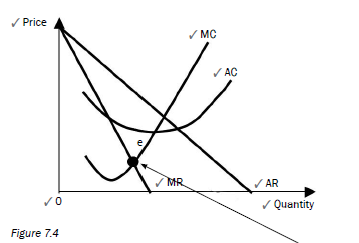
Step 4:
The most important point on the graph is where MC = MR (look for the dot ● ). At this point: equilibrium/ maximum profit/profit maximisation is reached (all the same point).
Step 5:
This dot is extended upwards and downwards. Your cost occurs where it meets the AC curve, and your market price occurs where it meets the AR curve (demand curve). Remember, a monopoly company will determine the price.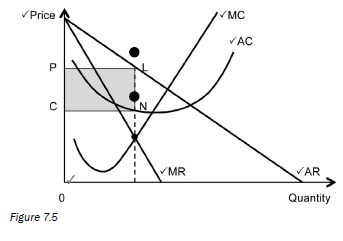
Practise drawing steps 1 to 5. Draw these over and over until you do not make any mistakes. In this way you will be able to draw the economic profit made by a monopoly.
The graph below shows the economic profit made by a monopoly: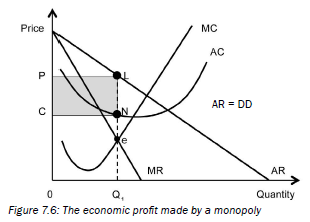
- The cost structure of the monopoly is the same as that of competitive businesses.
- Determine the point where MC = MR, the point where the production cost of the last unit is equal to the revenue it earns (point e) – profitmaximising production quantity of Q1 on the horizontal axis.
- To determine the price at which Q1 is sold, move vertically upwards from e to L on the demand curve. The market price is therefore determined at P.
- Total revenue is greater than the short-term total costs. The monopolist makes a profit (due to demand and cost of production).
7.3.3 Economic loss in the short term
When you draw the economic loss for the monopolist, the graph stays the same, EXCEPT the AC curve moves to the right - up, and totally misses the AR (demand) curve (see Figure 7.7).
| Remember: To draw the economic loss, you find the market price (OP) where the dotted line meets AR. Then extend the line further to meet the AC curve – THAT indicates your cost (OC). |
The total income = Price (OP) × Quantity (OQ) = the area OPNQ
The total cost = Cost (OC) × Quantity (OQ) = the area OCLQ.
Economic loss = income – cost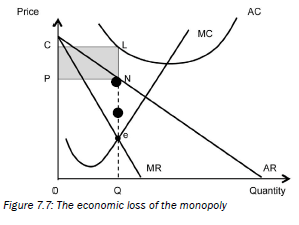
Practise drawing the economic loss of the monopoly over and over again until you do not make any mistakes.
Learn the following THREE bullets as a description for the economic loss of a monopoly:
- The monopoly suffers short-term losses when the AC curve lies above the demand curve (DD).
- Equilibrium is reached where MR = MC (a loss-minimising situation).
- The monopoly will produce a quantity Q and sell at price P. The total costs are the area OCLQ; the total revenue is the area OPNQ. The loss will be that part that is shaded (the area PCLN).
7.3.4 Comparison of a monopoly and a perfect market
| Monopoly | Perfect market |
| 1.Downward sloping DD curve MR curve lies below the DD curve | Horizontal DD curve MR curve same as DD curve |
| 2.Price setter (maker) | Price-taker |
| 3.Individual business is the industry | Individual businesses add up to make the industry |
| 4.Consumer buys less if the selling price is high (and vice versa) | Business can’t choose its price and if it sells at a different price it loses out |
| 5.Monopolist produces a lower output at higher prices and in so doing produces at sub-efficient quantities. It does not produce at the minimum point of the LAC curve | Larger output and lower prices. Economically efficient quantities produced. Produces on the lowest point on the AC curve |
| 6.Producer and consumer surpluses are smaller | Surpluses bigger |
| 7.Products differentiated – unique – no close substitutes | Product are homogenous |
| 8.Long-term: can make economic profit | Only normal profit in the long-term |
Loss Some people argue that a monopolist always makes an economic profit. This is not the case. Profitability of a monopolist depends on the demand for the product as well as the cost of production.
7.4 Oligopolies
An oligopoly exists when a small number of large companies are able to influence the supply of a product or service to a market. By controlling the supply of the product or service on the market, oligopolies aim to keep its prices and profits high. Oil companies are one of the best examples of an oligopoly. A special type of this market form is a duopoly – an industry with only two producers.
7.4.1 Characteristics of oligopolies
- There is limited competition. Only a few suppliers manufacture the same product.
- Products may be homogenous or differentiated.
- This market is characterised by mutual dependence. The decision of one company will influence and will be influenced by the decisions of the other companies.
- Oligopolies can frequently change their prices in order to increase their market share. However this can result in a price war.
- Extensive use is made non-price measures to increase market share e.g. advertising, efficient service or product differentiation.
- Producers have considerable control over the price of their products although not as much as in a monopoly.
- If oligopolies operate as a cartel, firms have an absolute cost advantage over the rest of the competitors in the industry. Abnormal high profits may be a result of joint decisions in an oligopoly.
- Entry is not easy in an oligopolistic market. This is due to brand loyalty and it also requires a large capital outlay.
7.4.2 Kinked demand curve for the oligopolist
- One theory devised by an American economist, Paul Sweezy, can be used to determine the oligopolist’s demand curve.
- An oligopolist faces a kinked demand curve. This demand curve consists of two sections.
- The top section, the section that relates to high prices is a very elastic slope (i.e. demand is very sensitive to a price change.)
- The bottom section, the section that relates to lower prices is very inelastic (i.e. demand is not sensitive to a price change).
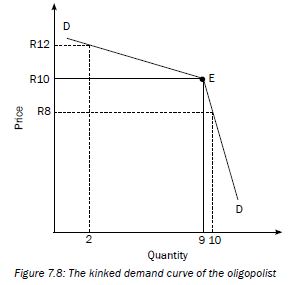
- To understand the demand curve of an oligopolist, view the graph below .

- Suppose the oligopolist is selling at the original/present price of R10 and 9 units of output are sold. Total revenue is R10 × 9 = R90
- If the firm tries to increase profit by increasing the price by R2 to R12, quantity demanded would fall to 2 units and total revenue would decrease to R24 (R12 × 2).
- If the firm tries to increase profit by reducing the price by R2 to R8 and increasing its total sales, total revenue would be R80.
- The oligopolist is therefore faced with a difficult decision because in both instances it will not benefit.
- Increasing the price of goods or reducing the price to increase sales will not lead to greater revenue earned.
7.4.3 Non-price competition
- Oligopoly firms are reluctant to change prices because a price war will drive prices down and profits will be eliminated.
- They make use of non-price measures to attract customers and increase their market share.
- An important aspect of non-price competition is to build brand loyalty, product recognition and product differentiation.
- This is done by means of advertising and marketing. As a result, oligopoly firms tend to spend a substantial amount of money on this.
Other forms of non-price competition include:
- extended shopping and business hours
- doing business over the internet
- after-sales services
- offering additional services
- loyalty rewards for customers
- door-to-door deliveries
Examples of firms that use kinds of non-price strategies are those in petrol retailing such as Shell, BP and Caltex and in the banking sector such as ABSA, FNB etc.
7.4.4 Collusion
Collusion takes place when rival firms cooperate by raising prices and by restricting production in order to maximise their profits. When there is a formal agreement between firms to collude it is called a cartel. A cartel is a group of producers whose goal is to form a collective monopoly in order to fix prices and limit supply and competition.
In general, cartels are economically unstable because there is a great incentive for members not to stick to the agreement, to cheat by cutting prices illegally and to sell more than the quotas set by the cartel. Although there is an incentive to collude there is also an incentive to compete. This has caused many cartels to be unsuccessful in the long term. Some well known cartels are the Organisation of Petroleum Exporting Countries(OPEC) and De Beers diamonds in South Africa.
Overt/Formal collusion e.g. cartels are generally forbidden by law in most countries. However, they continue to exist nationally and internationally. Sometimes in an oligopoly market, a dominant firm will increase the price of a product in the hope that its rivals will see this as a signal to do the same. This is referred to as price leadership and is an example of a tacit collusion.
7.5 Monopolistic competition
7.5.1 Characteristics of monopolistic competition
- The products are differentiated. Products are similar but not identical. The are similar in that they satisfy the same need of the consumer. There may be differences in packaging but the product is the same. e.g. sugar and salt.
- Differentiated products create opportunities for non-price competition e.g. advertising.
- Monopolistic competition displays a hybrid structure. It is a combination of competition and a monopoly.
- There are many sellers.This indicates the element of competition.
- Entry into the market is easy.
- Businesses have little control over the price of the product. Each business sells at its own price since a single price cannot be determined for the differentiated product because a range of prices could apply.
- Information for buyers and sellers is incomplete.
- Collusion is not possible under monopolistic competition.
- Restaurants, plumbers, lawyers, insurance brokers, hairdressers, funeral parlours and estate agents are all examples of monopolistic competitors.
See nonprice competition for oligopolies on page 109. Some forms are similar for monopolistic competition. Make sure you can draw the graphs for the monopolistic competitor.
7.5.2 Non-price competition
- Differentiated products create opportunities for non-price competition i.e. competition is not based on prices but rather on factors relating to the product’s uniqueness.
- Advertising campaigns and further product differentiation are powerful forms of non-price competition.
- The greater the product differentiation the less price elastic the demand for the product will be.
- Large sums of money are spent on research, development and advertising to build a loyal consumer group.
- Therefore brands play a significant role in determining customer loyalty where a consumer may choose one producer over another. Large chain stores e.g. Checkers, Spar etc. have their own brands for some products. Most of these products are exactly the same as known brands.
7.5.3 Prices and production levels in the short-term and long-term
- The demand curve for a monopolistic competitor is similar that of a monopolist.
- Short term equilibrium (economic profit and economic loss) corresponds with a monopoly, but the demand curve is more price elastic (flatter) due to good substitutes.
- Long-term equilibrium is characterised by normal profit, due to the ease of entry and exit into the market (similar to a perfect market). The economic profit made in the short-term attracts more businesses to enter the market.
7.5.4 Comparison of monopolistic competition with perfect competition
- Both firms make normal profit in the long run. Therefore there is no difference in the long-run between the perfect market and the monopolistic market as far as profit is concerned.
- The equilibrium price is higher than in a perfect market. The consumer therefore pays less in the perfect market and more in the monopolistic market.
- The monopolistic competitor does not produce at the minimum of the LAC whereas the perfect competitor does. He is less efficient.
- The perfect competitor produces more at a lower price while the monopolistic competitor produces less at a higher price.
7.6 Summary of market structures
| Firm | Perfect Competition | Monopolistic Competition | Oligopoly | Monopoly | |
| A | Number of firms | Many | Large numbers | Very few | One |
| B | Entry into market | Completely free/ unrestricted | Free/Unrestricted | Free but not easy Varies from free to restricted | Restricted or completely blocked |
| C | Nature of product | Homogenous/ Identical | Diffferentiated | Homogenous/ Differentiated | Unique (with no substitute) |
| D | Demand Curve | Horizontal – firm price taker | Downward sloping but relatively elastic | Downward sloping Kinked (relatively inelastic and elastic) | Downward sloping (INELASTIC) Equals the market demand curve |
| E | Market information (Knowledge of market conditions) | Perfect knowledge i.e. Complete | Incomplete | Incomplete | Perfect knowledge i.e. Complete |
| F | Control over market price | No control Price taker | Limited/some control | Substantial control but not price setters | Complete control Price setter/ makers |
| G | Profit/Loss | Short-run = economic profit/ loss Long-run = Normal profit | Short-run = economic profit/ loss Long-run = Normal profit | Economic profit in the long-run | Economic profit in short-run and long-run |
| H | Decision-making | Decision has no influence on others | Influenced by other competitors | Influenced by other competitors | Independent |
| I | Examples | Fresh produce | Restaurants | Petrol, Oil | Water & electricity supply (Eskom) |
| J | Collusion | Not possible | Not possible | Possible | Not relevant |
| K | Technical effifiency | Yes | Close | Possible | Possible |
| L | Allocative efficiency | Yes | Close | No | No |
Activity 2
Complete the following table by filling in the missing information:
| Characteristics | Perfect market | Monopolistic competition | Oligopoly | Monopoly |
| So many competitors that a singlebusiness cannot influence the market price | So few competitors that each business takes the actions of the others into account | |||
| Market entry | Completely free | Free | ||
| Downward sloping | ||||
| Long-term economic profit | Positive | |||
| Seller market power | ||||
| Control over price | Some control | Considerably more than oligopoly | ||
| Examples | Fast-food outlets | Eskom |
[20]
Answer to activity 2
| Characteristics | Perfect market | Monopolistic competition | Oligopoly | Monopoly |
| Number of businesses | So many competitors that a single business cannot influence the market price | A very large number | So few competitors that each business takes the actions of the others into account | One business |
| Market entry | Completely free | Free | Free to restricted | Blocked |
| Demand curve | Slopes from left to right | Downward sloping | Downward sloping | Downward sloping = market demand |
| Long term economic profit | Normal profit | Normal profit | Positive | Positive |
| Seller market power | None, price-taker | Some | A whole lot | Many (price-maker) |
| Control over price | None | Few | Considerable | Considerably more than oligopoly |
| Examples | Gold and oil | Fast-food outlets | Petrol and oil | Eskom |
[20]
Activity 3
Study the following graph and answer the questions that follow:
- Define the term imperfect market. (2)
- Motivate why the above graph indicates short-term equilibrium. (4)
- Which point on the graph indicates profit maximisation? (2)
- Calculate the economic profit. (6)
[14]
Answers to activity 3
|