THE DYNAMICS OF PERFECT MARKETS GRADE 12 NOTES - ECONOMICS STUDY GUIDES
Share via Whatsapp Join our WhatsApp Group Join our Telegram Group- Key concepts
- Review of production, costs and revenue
- Perfect competition
- The individual business and the industry
- Market structures
- Output, profit, losses and supply
- How to draw graphs to show various equilibrium positions
- Competition policies
A perfect market is characterised by perfect competition. The conditions that result in perfect competition include:
- Equal access to the technology required for production
- No barriers to entry or exit from the marketplace
- Accurate and available market information
- No participant with the power to set the market price
- According to equilibrium theory, a perfect market will reach an equilibrium where the quantity supplied equals the quantity demanded at the market price
Overview
| MAIN TOPIC: MICROECONOMICS | ||
| TOPIC | CONTENT | CONTENT DETAILS FOR TEACHING, LEARNING AND ASSESSMENT PURPOSES |
| 6. Dynamics of markets: Perfect markets | Examine the dynamics of perfect markets with
| HOT QUESTION: Examine in detail how
HOT QUESTION: Explain why the
As the various market structures
When teaching the various HOT QUESTION: Draw three fully labelled
HOT QUESTION: In your opinion is the |
6.1 Key concepts
These definitions will help you understand the meaning of key Economics concepts that are used in this study guide. Understand these concepts well.
| Term | Definition |
| Economic loss | When total costs are greater than total revenue. When average revenue is lower than average cost the firm makes an economic loss |
| Economic profit | Profit that is made in addition to normal profit. When average revenue is greater than average cost the firm makes an economic profit |
| Explicit cost | Actual expenditure of business, e.g. wages and interest |
| Implicit cost | Value of inputs owned by entrepreneur and used in the production process (forfeited rental, interest + salary) |
| Long run | The period of production where all factors can change. The time is long enough for variable and fixed factors to change |
| Market | An institution or mechanism that brings together buyers and sellers of goods or services |
| Market structure | How a market is organised |
| Monopolistic competition | A market structure in which businesses have many competitors, but each one sells a slightly different product (e.g. CD’s and books) |
| Monopoly | Exclusive control of a commodity or service in a particular market |
| Normal profit | The minimum earnings required to prevent an entrepreneur from leaving the industry. When average revenue equals average cost the firm makes a normal profit |
| Oligopoly | A market structure controlled by a small group of businesses |
| Perfect competition | A market structure with large numbers of producers and buyers |
| Price taker | Has no influence on price. Takes price that is determined by the market |
| Short run | The period of production where only the variable factors of production can change while at least one factor is fixed |
| Shut-down point | Business will close where MC = AVC |
| The Competition Appeal Court | An institution whose main functions is to review orders made by the Competition Tribunal and amend or confirm these orders |
| The Competition Commission | An institute that investigates restrictive business practices, abuse of dominant positions and mergers in order to achieve equity in the South African economy |
| The Competition Tribunal | An institution whose main function is to approve large mergers, adjudicate in the case of misconduct and issue orders on matters presented to it by the Competition Commission |
Use mobile notes to help you learn these concepts. Instructions for making them are on page xiv in the introduction.
6.2 Review of production, costs and revenue
Production takes place in the short run and the long run
- Short run
The short run is the period of production where only the variable factors of production can change. The time period is too short to permit the number of firms in the industry to change. - Long run
The long run is the period of production where all factors can change. The time is long enough for variable and fixed factors to change. It allows enough time for new firms to enter the industry and/or existing firms to exit.
| Total Product/Output | Total product is the maximum output that the firm can produce with the given number of fixed and variable inputs at its disposal | |
| Marginal Product/Output | Marginal product is the additional unit of output which is produced as one more unit of the variable input (labour) is combined with the fixed input | MP=ΔTP ΔQ |
| Average Product/Output | Average product of a variable input shows the contribution that each labourer makes towards production | AP = P Q |
| Fixed Costs (indirect costs/overhead costs) | Costs that remain the same even if the output changes. Examples are rent, depreciation, insurance | |
| Variable Costs (direct costs/prime costs) | Costs that change according to changes in output. E.g. wages the cost of raw materials, electricity etc. | |
| Total cost | The cost/remuneration for all the factors of production used in the production process | TC = FC + VC |
| Marginal costs | Marginal cost is the amount by which total cost increases when one extra product is produced | MC = ΔTC ΔQ |
| Average cost | Average cost is the cost per unit of production | AC = AFC + AVC or TC Q |
| Average fixed cost | To calculate average fixed costs, we divide fixed costs by the amount of goods produced | AFC = FC Q |
| Average varible cost | To calculate average variable costs, we divide variable costs by the amount of goods produced | AVC = VC Q |
| Total Revenue | Total revenue is the total income received from the sale of goods or services | TR = P × Q |
| Marginal revenue | Marginal revenue refers to the extra amount of income gained by selling one more unit of production | MR = ΔTR ΔQ |
| Average revenue | Average revenue refers to the amount a firm earns for every unit sold | AR = TR Q |
Table 6.1: Review of production, costs and revenue
It is important to review production, cost and revenue concepts covered in Grade
11. This is vitally important for the understanding of cost and revenue curves for the different market structures which you will study in this section.
Summary of costs
| Cost schedule for Kael’s Pie shop | |||||||
| Q | TFC | TVC | TOTAL COSTS | AFC = TFC Q | AVC = TVC Q | (ATC = AFC + AVC) or TC Q | MC = ΔTC ΔQ |
| 0 | 120 | 0 | 120 | - | - | - | |
| 10 | 120 | 100 | 220 | 12 | 10 | 22 | 10 |
| 20 | 120 | 160 | 280 | 6 | 8 | 14 | 6 |
| 30 | 120 | 210 | 330 | 4 | 7 | 11 | 5 |
| 40 | 120 | 280 | 400 | 3 | 7 | 10 | 7 |
| 50 | 120 | 400 | 520 | 2.4 | 8 | 10.4 | 12 |
| 60 | 120 | 600 | 720 | 2 | 10 | 12 | 20 |
| 70 | 120 | 910 | 1030 | 1.7 | 13 | 14.7 | 31 |
Table 6.2: Summary of costs
The following sketches should resemble the shape for the above cost curves.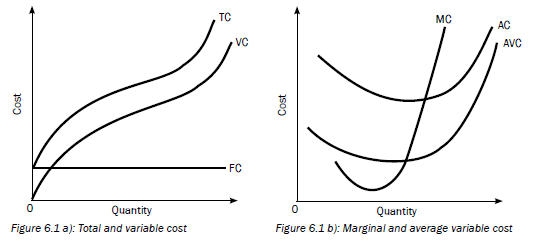
Important observations
- The difference between the total cost and variable cost is the fixed cost
- TVC curve starts from 0 and TC starts from the fixed cost curve on the Y- axis.
- The gap between the AC curve and the AVC curve gets smaller as output increases.
- The MC Curve will always cut the AC and AVC curves at their minimum points.
6.3 Perfect competition
Perfect competition occurs in a market structure with a large number of participants who have access to all required information about the market place and are all price-takers. Prices are determined by demand and supply. Examples of market structures demonstrating most conditions of a perfect competition include the stock exchange, the foreign exchange market, the central grain exchange, and agricultural produce markets.
A perfect market is a market where no single buyer or seller has a noticeable influence on the price of a good. This gives a true reflection of the scarcity value of goods and services.
6.3.1 Characteristics/conditions of a perfect market
Products must be homogenous (i.e. identical)
- Products must be identical. There should be no differences in style, design and quality.
- In this way products compete solely on the basis of price and can be purchased anywhere.
There should be a large number of buyers and sellers
- It should not be possible for one buyer or seller to influence the price.
- When there are many sellers the share of each seller in the market is
so small that the seller cannot influence the price. - Sellers are price takers, they accept the prevailing market price. If they increase prices above the market price, they will lose customers.
No preferential treatment/discrimination
- Collusion occurs when buyers and sellers make an agreement to limit competition. In a perfect market no collusion takes place.
- Buyers and sellers base their actions solely on price, homogenous products fetch the same price and therefore no preference is shown for buying from or selling to any particular person.
Free competition
- Buyers must be free to buy whatever they want from any firm and in any quantity.
- Sellers must be free to sell what, how much and where they wish.
- There should be no State interference and no price control.
- Buyers should not form groups to obtain lower prices, nor should sellers combine to enforce higher prices.
Efficient transport and communication
- Efficient transport ensures that products are made available everywhere.
- In this way changes in demand and supply in one part of the market will influence the price in the entire market.
- Efficient communication keeps buyers and sellers informed about market conditions.
All participants must have perfect knowledge of market conditions
- All buyers and sellers must be fully aware of what is happening in any part of the market.
- Technology has increased competition as information is easily obtained via the internet.
Free access to and from markets
- Producers may enter and leave a market with little interference.
- Entering and leaving a perfect market is easy as less capital is required and there are fewer legal restrictions.
The factors of production are completely mobile
- They can move freely between markets.
In reality there are few perfect markets, however there are some sectors such as mining (e.g. gold) and agriculture (e.g. maize) where many of the conditions are met. These sectors illustrate the way in which the market mechanism works.
6.4 The individual business and the industry
6.4.1 Determining the market price
To determine the market price for a firm under perfect competition you need to draw two graphs next to each other. On the left is the graph for the industry and on the right is the graph for the firm (individual producer).
- Figure 6.2 a) (the industry) shows the interaction of demand and supply (market forces).
- The market forces are in equilibrium at the point of intersection of the demand and supply curves, at “e”.
- At equilibrium the quantity demanded is equal to the quantity supplied. This determines the market price.
- Now look at Figure 6.2 b) (firm or individual producer). One producer will not be able to influence the market price and has to accept the market price (P1), he is a price taker.
- Because this is the only price the producer can charge, the demand curve for the producer is a straight line drawn at price P1.
- This horizontal line at the market price (P1) is the demand curve (DD), the average revenue (AR) curve and the marginal revenue (MR) curve.
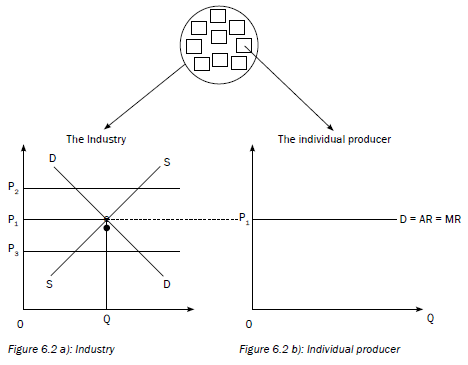
Read this section on graphs through five times, and redraw each graph each time.
6.4.2 Demand curve for an individual producer
The individual producer is a price taker and sells goods at the market price. At this price, demand remains constant. A higher price such as P2 cannot be charged as customers will be lost to other producers.
A lower price such as P3 cannot be charged as a small profit or a loss will be made.
| Quantity | Price (P) | Total Revenue | Marginal Revenue MR = ΔTR ΔQ | Average Revenue AR = TR Q |
| 0 | 5 | 0 | 5 | 5 |
| 1 | 5 | 5 | 5 | 5 |
| 2 | 5 | 10 | 5 | 5 |
| 3 | 5 | 15 | 5 | 5 |
| 4 | 5 | 20 | 5 | 5 |
| 5 | 5 | 25 | 5 | 5 |
| 6 | 5 | 30 | 5 | 5 |
Table 6.3: depicting the DEMAND, MARGINAL REVENUE and AVERAGE REVENUE for an individual producer in a perfect market.
Remember that demand = AR = MR = P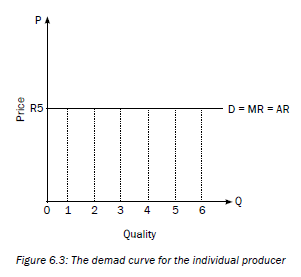
6.4.3 Profit maximisation
Occurs in 2 ways:
1.
| Quantity | Price (P) | Marginal Revenue | Marginal cost | Contribution to profits |
| 1 | 5 | 5 | 2 | 3 |
| 2 | 5 | 5 | 3 | 2 |
| 3 | 5 | 5 | 4 | 1 |
| 4 | 5 | 5 | 5 | 0 |
| 5 | 5 | 5 | 6 | -1 |
| 6 | 5 | 5 | 7 | -2 |
Table 6.4: Depicting profit maximisation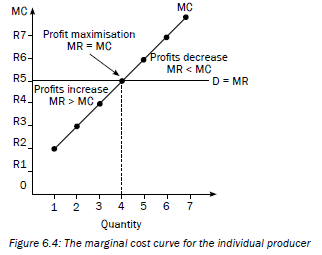
Profit maximisation occurs where MR = MC
- At all pionts where MR is above MC, the firm is adding to profit. From unit 1-3, the firm is increasing its profit.
- At all points where MC is above MR, the firm is decreasing profit. From unit 5-7, the firm’s profit will decrease.
- The firm maximises profit where MR = MC. The firm maximises its profits at unit 4.
2.
| Quantity | Price (P) | Total Revenue | Total cost | Profit (Difference between revenue and cost) |
| 0 | 5 | 0 | 1 | -1 |
| 1 | 5 | 5 | 3 | 2 |
| 2 | 5 | 10 | 6 | 4 |
| 3 | 5 | 15 | 10 | 5 |
| 4 | 5 | 20 | 15 | 5 |
| 5 | 5 | 25 | 21 | 4 |
| 6 | 5 | 30 | 28 | 2 |
Table 6.5: Depicting Profit Maximisation
- If TC > TR the business makes a loss. If TR > TC it makes a profit.
- Maximum profit is achieved at units 3 and 4.
- Once the maximum profit is achieved, profits start to decrease with the next unit of output.
- Therefore the firm will not produce more than 4 units.
PROFIT MAXIMISATION occurs where the difference between TR and TC is at a MAXIMUM (TR – TC)
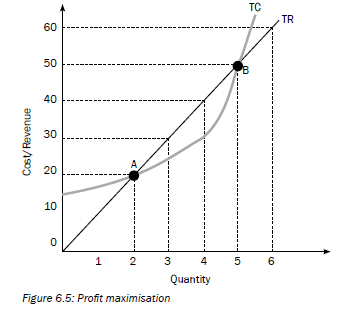
Figure 6.5 provides a clearer picture of Profit Maximisation. Interpret it!
Interpretation of graph:
- At all points where TR is above TC, the firm is making a profit.
- At all points where TC is above TR, the firm is making a loss.
- The gap between TR and TC represents profit.
- Profit is maximised when the gap between TR and TC is the greatest.
This is occurs at between 3 and 4 units.
6.5 Market structures
There are FOUR different market structures:
- Perfect competition
- Monopolistic competition
- Oligopoly
- Monopoly
Table 6.6 shows the 5 broad characteristics which distinguish the four market structures:
As you study each market structure in detail, you will be able to identify more distinguishing characteristics.
| Characteristic | Perfect competition | Monopolistic competition | Oligopoly | Monopoly |
| Number of businesses | Enough that a single business cannot influence the market price | A very large number | So few that each business must take the actions of the others into account | One business |
| Nature of product | Homogenous (same kind) | Differentiated, e.g. cool drinks | Homogenous or differentiated | Unique product without any close substitutes |
| Market entry | Completely free | Free | From free to restricted | Blocked |
| Control over price | None | Few | Considerable, but less than with a monopoly | Considerable |
| Information | Complete | Incomplete | Incomplete | Complete |
| Examples | International commodity markets, e.g. gold and oil | Fast-food outlets | Petrol and oil markets | Eskom |
Table 6.6: The characteristics of different market structures
The illustration below shows the four different market structures: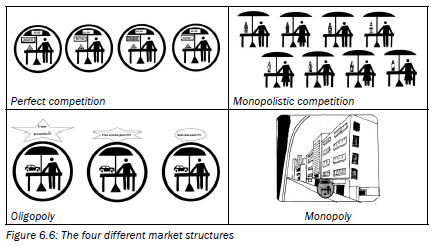
6.6 Output, profit, losses and supply
6.6.1 The individual business
Short term equilibrium position
1. Economic profits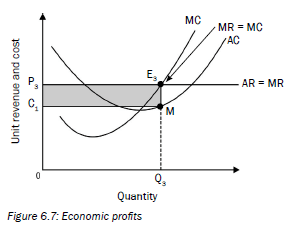
- Given a market price of P3, profit is maximised where MR = MC = P3.
- This occurs at a quantity of Q3.
- At Q3 the firm’s average revenue (AR) per unit of production is P3,
- The average cost per unit is C1 which is lower than the price of P3.
- The firm is making an economic profit per unit of production of P3 – C1.
Another explanation
- Total revenue equals P3 × Q3, therefore total revenue is represented by the area 0P3E3Q3.
- Total cost equals C1 × Q3, this is represented by the area 0C1MQ3.
- The difference between these two areas is the economic profit which is represented by the light grey shaded area C1P3E3M.
When Average Revenue is above Average cost the firm makes an ECONOMIC PROFIT.
2. Economic Losses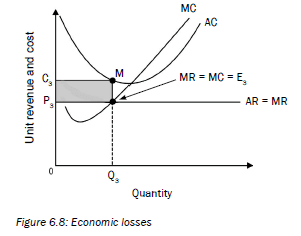
- Given a market price of P3, profit is maximised where MR = MC at point E3.
- This occurs at a quantity of Q3.
- At Q3 the firm’s average revenue (AR) per unit of production is P3,
- The average cost per unit is C3 which is higher than the price of P3.
- The firm is making an economic loss per unit of production which is equal to the difference between C3 and P3.
Another explanation.
- Total revenue equals P3 × Q3, therefore total revenue is represented by the area 0P3E3Q3.
- Total cost equals C3 × Q3, this is represented by the area 0C3MQ3.
- The difference between these two areas is the economic loss which is represented by the light grey shaded area C3P3E3M.
- Whether the firm should continue production would depend on the level of AR (that is P3) relative to the firm’s average variable cost.
3. Normal profits
- A firm makes normal profits when total revenue (TR) equals total costs or when average revenue (AR) equals average cost (AC).
- Normal profit is the maximum return the owner of a firm expects to receive to keep on operating in the industry.
When Average Revenue is below Average Cost the firm makes an ECONOMIC LOSS.
When Average Revenue equals Average Cost the firm makes a NORMAL PROFIT.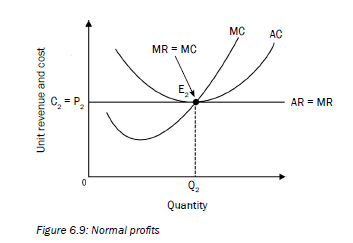
- Given a market price of P2, profit is maximised where MR = MC = P2.
- This occurs at a quantity of Q2.
- At Q2 the firm’s average revenue (AR) per unit of production is P2, which is also equal to the average cost per unit C2 (AC).
- Since AR = AC, the firm earns a normal profit since all its costs are fully covered.
- Point E2 is usually called the break-even point.
Another explanation
- Total revenue equals P2 x Q2, therefore total revenue is represented by the area 0P2E2Q2.
- Total cost equals C2 × Q2, this is represented by the area 0P2E2Q2.
- Since Total revenue equals Total Cost the producer makes a normal profit.
The individual business can make an economic profit, economic loss or normal profit in the Short Run. They are referred to as short run equilibrium positions.
In the long run the individual business will always make normal profit.
6.6.2 The industry
The long term equilibrium for the industry and the individual firm
The impact of entry and exit on the equilibrium of the firm and industry
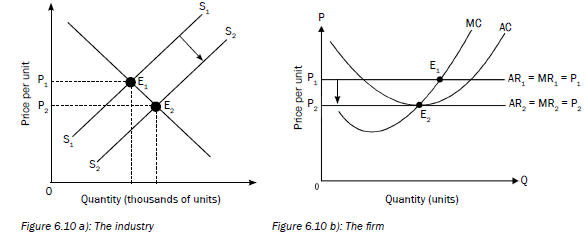
- Profits are a signal for the entry of new businesses.
- Losses are a signal for businesses to leave the market.
- The long-term equilibrium in the perfect market will be influenced by the entry or exit of individual businesses.
- Entry into the apple market

- If individual farmers are earning an economic profit at P1.
- New farmers will enter the market, more apples will be supplied.
- The market supply curve will shift to the right from S1 to S2.
- The Equilibrium price will drop from P1 to P2.
- Individual farmers will then earn normal profits. There will be no further reason for new farmers to enter the market. The industry is in equilibrium.
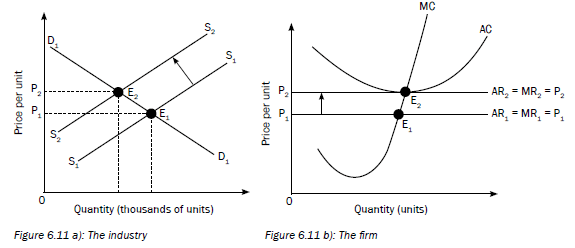
- Exit from the apple market

- If individual farmers are making economic losses, some farmers may leave the industry.
- When a few farmers leave the market, fewer apples will be supplied.
- The market supply curve will shift to the left from S1S1 to S2S2.
- The equilibrium price will increase from P1 to P2. Individual farmers will then earn normal profits. There will be no reason for individual farmers to leave the market.
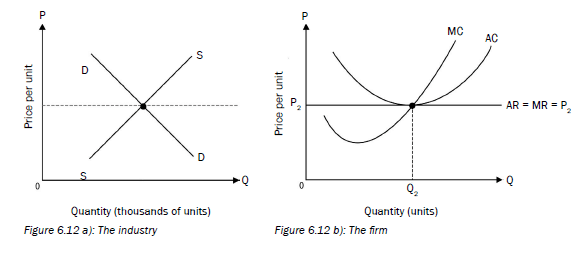
- Therefore in a perfect market the long term equilibrium is achieved when individual firms earn a normal profit.
- Longterm equilibrium – normal profit

6.6.3 The supply curve of an individual firm
The short-run supply curve of an individual producer is that part of the marginal cost curve that is above the minimum average variable cost. This starts from shut-down point upwards. Below the shut-down point, the firm will not sell any goods. A firm will sell goods if the price is above the shutdown price level. This is shown in Figure 6.13 below: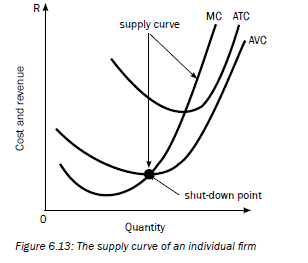
6.6.4 Shut-down/closing down point
Shut-down point
A firm will shut down if it cannot meet its average or total variable costs.
Hence we conclude that:
ACTUAL SHUT-DOWN should only take place when:
|
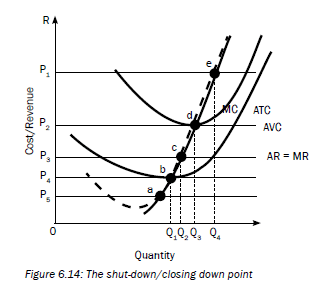
- Point a: a firm will not produce here because AR < AVC
- Point b: it is the lowest price that the firm will charge (shut-down point). It represents the beginning of the supply curve.
- Point c: the firm is making an economic loss. Because AR < AC.
The loss is minimised because the firm produces where MR = MC. - Point d: the firm is making normal profit (breaking even) because AR = AC.
- Point e: the firm is making economic (supernormal) profits because AR > AC.
6.7 How to draw graphs to show various equilibrium positions
First draw your TWO axes: Price (P) on the vertical axis and Quantity (Q) on the horizontal axis. Remember, they meet at the origin (0). Note that the labelling of the axes is not the same for all graphs.
In showing the various equilibrium positions the following sequence should be followed.
- Draw the demand curve followed by the Marginal revenue curve, (in a perfect market D = MR = AR).
- Then draw the AC curve.
- Then draw the MC curve which must cut the AC curve at its minimum point.
- Identify profit maximising point. MC = MR
- Determine quantity (drop a line from the profit maximizing point to the x-axis).
- Determine price (extend line upwards from the profit maximizing point to the demand curve) and then extend the line horizontal to the y-axis.
- Compare AR/price to AC to determine profit or loss.
Everything is important – do not leave out anything! Each step counts for marks. Label all axes, curves and graphs.
Note the following:
- To show economic profit the AC curve must cut the demand curve.
- To show normal profit the minimum point on AC curve must be at a tangent to the demand curve.
- To show economic loss the AC curve must not touch demand curve.
6.8 Competition policies
6.8.1 Description
Competition refers to the existence of free entry into and exit from markets.
This ensures that markets are not dominated by certain businesses.
6.8.2 Goals of competition policy
- To prevent monopolies and other powerful businesses from abusing their power.
- To regulate the formation of mergers and acquisitions who wish to exercise market power.
- To stop firms from using restrictive practices like fixing prices, dividing markets etc.
6.8.3 The Competition Act in South Africa
The government introduced the Competition Act 89 of 1998 to promote competition in South Africa in order to achieve the following objectives:
- promote the efficiency of the economy (its primary aim)
- provide consumers with competitive prices and a variety of products
- promote employment
- encourage South Africa to participate in world markets and accept foreign competition in South Africa
- enable SMMEs to participate in the economy
- to allow the previously disadvantaged to increase their ownership of businesses
6.8.4 Institutions
The Competition Commission
It investigates restrictive business practices, abuse of dominant positions and mergers in order to achieve equity and efficiency in the South African economy.
The Competition Tribunal
It has jurisdiction throughout the Republic. It is a tribunal of record and independent from the other competition institutions.
The Tribunal’s main functions are to: grant exemptions, authorise or prohibit large mergers, adjudicate if any misconduct takes place, issue an order for costs on matters presented to it by the Competition Commission.
The Competition Appeal Court
Its status is similar to the High court. It has jurisdiction throughout the Republic and is a court of record.
Its main functions are to review orders made by the Competition Tribunal and amend or confirm these orders.
Activity 1
Study the diagram below and answer the questions that follow.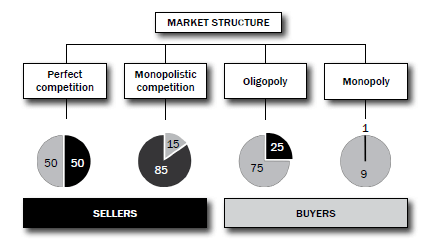
- Define the concept market structure. (2)
- How many sellers will one find in a monopoly market? (2)
- In what market are all participants price-takers? Motivate your answer. (4)
- Explain the shape of the individual demand curve under perfect competition. (4)
- Under which market structure will you place the following businesses?
- KFC
- Eskom
- Vodacom (6)
- Explain in your own words the message behind the pie-charts shown above. (4)
[22]
Answers to activity 1
|
[22]