THE CIRCULAR FLOW MODEL, NATIONAL ACCOUNT AGGREGATES AND THE MULTIPLIER QUESTIONS AND ANSWERS GRADE 12
Share via Whatsapp Join our WhatsApp Group Join our Telegram GroupActivity 1
Study the diagram below and answer the questions that follow: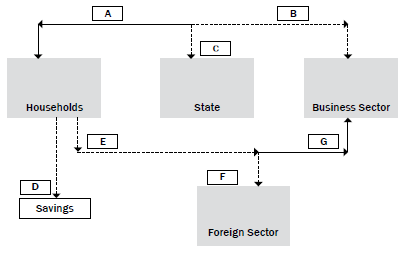
1.1 Use the information below and calculate the values A – G: (7)
Total production R25 000 Income Taxation R 5 000
Savings R4 000 Imports R 3 700
1.2 Explain the impact of an increase in income taxes on the level of production. (3)
1.3 Calculate the total leakages (L) in the above diagram. (4)
1.4 Give the identity (equation) used to represent GDP in an open economy. (2)
1.5 If a country has a marginal propensity to consume of 0.1, calculate the value of the multiplier. (4)
[20]
| Answers to activity 1 1.1 A – R20 0003 B – R25 0003 C – R5 0003 D – R4 0003 E – R16 0003 F – R3 7003 G – R12 3003 (7) 1.2 Leads to a decline in production333 (3) 1.3 S + T + M3 R4 000 + R5 000 + R3 7003 R12 70033 (4) 1.4 C + G + I + (X – M)33 (2) 1.5 M = 1/(1 – mpc)3 = 1/(1 – 0,1)3 = 1/0.93 = 1.13 (4) [20] |
Activity 2
Study the following data and answer the question that follows:
| Compensation of employees R1 086 907; Final consumption expenditure by households R1 472 824; Net operating surplus R728 426; Final consumption expenditure by government R504 169; Taxes on products R245 198; Subsidies on products R3 113; Taxes on production R38 173; Subsidies on production R 5 092; Gross capital formation R467 878; Exports of goods and services R657 113; Imports of goods and services R667 740; Consumption of fixed capital R332 824; Primary sector R278 518; Secondary sector R466 749; Tertiary sector R1 435 971. |
1. Determine the gross domestic product at market prices according to the production method. [10]
| Answer to activity 2 1. Primary sector R 278 518 Secondary sector R 466 749 Tertiary sector R1 435 971 Gross value added at basic prices 3 2 181 238 Plus taxes on products R 245 198 Less subsidies on products R 3 113 Gross domestic product @ market price R2 423 323 [10] |
Activity 3
Refer to Table 1.3.2 (income method) and answer the following questions:
- Which financial institution is responsible for the recording and publishing of GDP figures in South Africa? (2)
- Explain the concept ‘subsidies on products’. (3)
- Give TWO examples of taxes on products. (4)
- Calculate the consumption of fixed capital in 2009 as a percentage of GDP at market price. Show all calculations. (4)
- What is the difference between 2007 and 2011 concerning the GVA @ factor cost? (2)
Answers to activity 3
|
Activity 4
Two key national accounts conversions
A. How to convert domestic totals to national totals:
| 2005 | 2007 | 2009 | 2011 | |
| GDP @ MARKET PRICES | 1 571 082 | 2 016 185 | 2 398 155 | 2 964 261 |
| PLUS: Primary income from the rest of the world | 29 550 | 48 448 | 34 075 | 38 118 |
| MINUS: Primary income to the rest of the world | 60 975 | 117 266 | 87 593 | 104 689 |
| GNP @ MARKET PRICES | 1 539 657 | 1 947 367 | 2 344 637 | 2 897 690 |
Table 1.3.4: How to convert domestic totals to national totals
PLEASE NOTE! Table 1.3.4 shows you how to apply the conversion of domestic figures to national figures and vice versa. You must learn these conversions.
Study Table 1.3.5 below and answer the questions that follow.
| NATIONAL ACCOUNT AGGREGATES | R MILLIONS |
| Final consumption expenditure by households | 1 473 490 |
| Final consumption expenditure by government | 505 040 |
| Gross capital formation | 467 878 |
| Residual item | –18 092 |
| Gross Domestic Expenditure (GDE) | 2 428 316 |
| Export of goods and services | 657 113 |
| Import of goods and services | 677 740 |
| Expenditure on GDP at market prices | A |
Table 1.3.5: National account aggregates
- Explain the concept gross capital formation. (2)
- Calculate the value of A. Show all calculations. (4)
- Differentiate between GVA at basic prices and Expenditure on GDP at market price. (3)
[9]
Answers to activity 4
|
Activity 5
Study the graph below of the Keynesian model in a two-sector economy where the consumption function is given by C = c0 + c(Y) and answer the questions that follow.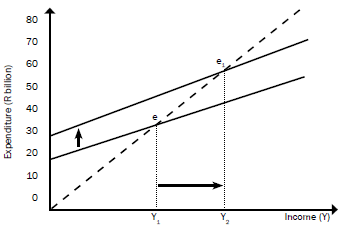
- Define the term multiplier. (3)
- With reference to the graph, name the TWO sectors involved in deriving the macro-economic multiplier. (4)
- Indicate what is represented by the dotted line. (2)
- What is the value of autonomous consumption for the original consumption function? (2)
- Suppose the marginal propensity to save (MPS) = 0.4. Use the multiplier formula to calculate the eventual change in aggregate income, if there was an injection of R10 billion into the economy. Show ALL the calculations. (6)
- Describe the relationship between the mpc and the multiplier. (3)
[20]
Determine the size of the multiplier first.
Answers to activity 5
|